MetLife 2008 Annual Report Download - page 164
Download and view the complete annual report
Please find page 164 of the 2008 MetLife annual report below. You can navigate through the pages in the report by either clicking on the pages listed below, or by using the keyword search tool below to find specific information within the annual report.-
 1
1 -
2
-
3
-
4
-
5
-
6
-
7
-
8
-
9
-
10
-
11
-
12
-
13
-
14
-
15
-
16
-
17
-
18
-
19
-
20
-
21
-
22
-
23
-
24
-
25
-
26
-
27
-
28
-
29
-
30
-
31
-
32
-
33
-
34
-
35
-
36
-
37
-
38
-
39
-
40
-
41
-
42
-
43
-
44
-
45
-
46
-
47
-
48
-
49
-
50
-
51
-
52
-
53
-
54
-
55
-
56
-
57
-
58
-
59
-
60
-
61
-
62
-
63
-
64
-
65
-
66
-
67
-
68
-
69
-
70
-
71
-
72
-
73
-
74
-
75
-
76
-
77
-
78
-
79
-
80
-
81
-
82
-
83
-
84
-
85
-
86
-
87
-
88
-
89
-
90
-
91
-
92
-
93
-
94
-
95
-
96
-
97
-
98
-
99
-
100
-
101
-
102
-
103
-
104
-
105
-
106
-
107
-
108
-
109
-
110
-
111
-
112
-
113
-
114
-
115
-
116
-
117
-
118
-
119
-
120
-
121
-
122
-
123
-
124
-
125
-
126
-
127
-
128
-
129
-
130
-
131
-
132
-
133
-
134
-
135
-
136
-
137
-
138
-
139
-
140
-
141
-
142
-
143
-
144
-
145
-
146
-
147
-
148
-
149
-
150
-
151
-
152
-
153
-
 154
154 -
 155
155 -
 156
156 -
 157
157 -
 158
158 -
 159
159 -
 160
160 -
 161
161 -
 162
162 -
 163
163 -
 164
164 -
 165
165 -
 166
166 -
 167
167 -
 168
168 -
 169
169 -
 170
170 -
 171
171 -
 172
172 -
 173
173 -
 174
174 -
175
-
176
-
177
-
178
-
179
-
180
-
181
-
182
-
183
-
184
-
185
-
186
-
187
-
188
-
189
-
190
-
191
-
192
-
193
-
194
-
195
-
196
-
197
-
198
-
199
-
200
-
201
-
202
-
203
-
204
-
205
-
206
-
207
-
208
-
209
-
210
-
211
-
212
-
213
-
214
-
215
-
216
-
217
-
218
-
219
-
220
-
221
-
222
-
223
-
224
-
225
-
226
-
227
-
228
-
229
-
230
-
231
-
232
-
233
-
234
-
235
-
236
-
237
-
238
-
239
-
240
 |
 |

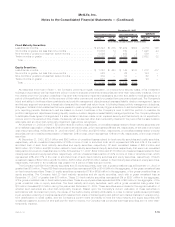
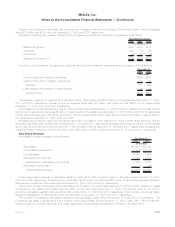
Certain of the Company’s real estate joint ventures have mortgage loans with the Company. The carrying values of such mortgages
were $372 million and $373 million at December 31, 2008 and 2007, respectively.
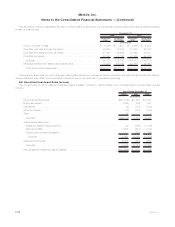
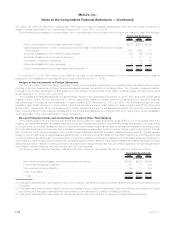
Information regarding loan valuation allowances for mortgage and consumer loans held-for-investment is as follows:
2008 2007 2006
Years Ended December 31,
(In millions)
BalanceatJanuary1, ................................................. $197 $182 $172
Additions ......................................................... 200 76 36
Deductions........................................................ (93) (61) (26)
BalanceatDecember31,............................................... $304 $197 $182
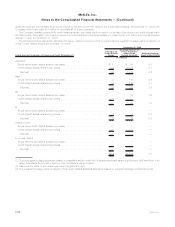
A portion of the Company’s mortgage and consumer loans held-for-investment was impaired and consisted of the following:
2008 2007
December 31,
(In millions)
Impairedloanswithvaluationallowances .......................................... $259 $622
Impairedloanswithoutvaluationallowances ........................................ 52 44
Subtotal.............................................................. 311 666
Less:Valuationallowancesonimpairedloans ....................................... 69 72
Impairedloans.......................................................... $242 $594
The average investment in impaired loans was $389 million, $453 million and $202 million for the years ended December 31, 2008,
2007 and 2006, respectively. Interest income on impaired loans was $10 million, $38 million and $2 million for the years ended
December 31, 2008, 2007 and 2006, respectively.
The investment in restructured loans was $1 million and $2 million at December 31, 2008 and 2007, respectively. Interest income
recognized on restructured loans was $1 million or less for each of the years ended December 31, 2008, 2007 and 2006. Gross interest
income that would have been recorded in accordance with the original terms of such loans also amounted to $1 million or less for each of
the years ended December 31, 2008, 2007 and 2006.
Mortgage and consumer loans with scheduled payments of 90 days or more past due on which interest is still accruing, had an
amortized cost of $2 million and $4 million at December 31, 2008 and 2007, respectively. Mortgage and consumer loans on which interest
is no longer accrued had an amortized cost of $11 million and $28 million at December 31, 2008 and 2007, respectively. Mortgage and
consumer loans in foreclosure had an amortized cost of $28 million and $12 million at December 31, 2008 and 2007, respectively.
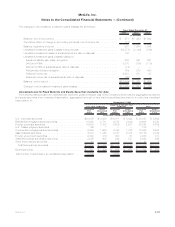
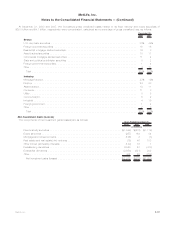
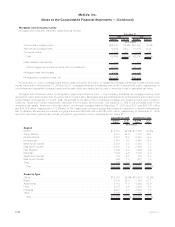
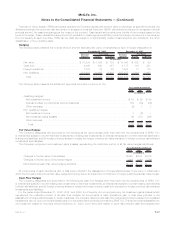
Real Estate Holdings
Real estate holdings consisted of the following:
2008 2007
December 31,
(In millions)
Realestate .......................................................... $5,441 $5,167
Accumulateddepreciation ................................................ (1,378) (1,210)
Netrealestate........................................................ 4,063 3,957
Realestatejointventures................................................. 3,522 2,771
Realestateandrealestatejointventures ..................................... 7,585 6,728
Realestateheld-forsale ................................................. 1 39
Totalrealestateholdings................................................ $7,586 $6,767
Related depreciation expense on real estate was $136 million, $130 million and $131 million for the years ended December 31, 2008,
2007 and 2006, respectively. These amounts include less than $1 million, $2 million and $27 million of depreciation expense related to
discontinued operations for the years ended December 31, 2008, 2007 and 2006, respectively.
There were no impairments recognized on real estate held-for-sale for the year ended December 31, 2008 and 2007. Impairment losses
recognized on real estate held-for-sale were $8 million for the year ended December 31, 2006. The carrying value of non-income
producing real estate was $28 million and $12 million at December 31, 2008 and 2007, respectively. The Company owned real estate
acquired in satisfaction of debt was $2 million and $3 million at December 31, 2008 and 2007, respectively.
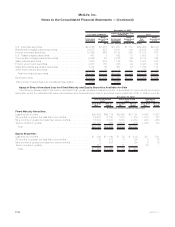
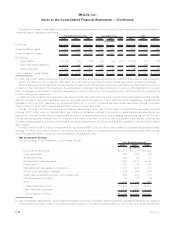
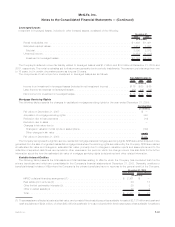
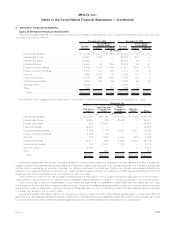
The Company diversifies its real estate holdings by both geographic region and property type to reduce risk of concentration. The
Company’s real estate holdings are primarily located in the United States, and at December 31, 2008, 22%, 13%, 11% and 8% were
located in California, Florida, New York and Texas, respectively. Property type diversification is shown in the table below.
F-41MetLife, Inc.
MetLife, Inc.
Notes to the Consolidated Financial Statements — (Continued)