MetLife 2008 Annual Report Download - page 153
Download and view the complete annual report
Please find page 153 of the 2008 MetLife annual report below. You can navigate through the pages in the report by either clicking on the pages listed below, or by using the keyword search tool below to find specific information within the annual report.-
 1
1 -
2
-
3
-
4
-
5
-
6
-
7
-
8
-
9
-
10
-
11
-
12
-
13
-
14
-
15
-
16
-
17
-
18
-
19
-
20
-
21
-
22
-
23
-
24
-
25
-
26
-
27
-
28
-
29
-
30
-
31
-
32
-
33
-
34
-
35
-
36
-
37
-
38
-
39
-
40
-
41
-
42
-
43
-
44
-
45
-
46
-
47
-
48
-
49
-
50
-
51
-
52
-
53
-
54
-
55
-
56
-
57
-
58
-
59
-
60
-
61
-
62
-
63
-
64
-
65
-
66
-
67
-
68
-
69
-
70
-
71
-
72
-
73
-
74
-
75
-
76
-
77
-
78
-
79
-
80
-
81
-
82
-
83
-
84
-
85
-
86
-
87
-
88
-
89
-
90
-
91
-
92
-
93
-
94
-
95
-
96
-
97
-
98
-
99
-
100
-
101
-
102
-
103
-
104
-
105
-
106
-
107
-
108
-
109
-
110
-
111
-
112
-
113
-
114
-
115
-
116
-
117
-
118
-
119
-
120
-
121
-
122
-
123
-
124
-
125
-
126
-
127
-
128
-
129
-
130
-
131
-
132
-
133
-
134
-
135
-
136
-
137
-
138
-
139
-
140
-
141
-
142
-
 143
143 -
 144
144 -
 145
145 -
 146
146 -
 147
147 -
 148
148 -
 149
149 -
 150
150 -
 151
151 -
 152
152 -
 153
153 -
 154
154 -
 155
155 -
 156
156 -
 157
157 -
 158
158 -
 159
159 -
 160
160 -
 161
161 -
 162
162 -
 163
163 -
164
-
165
-
166
-
167
-
168
-
169
-
170
-
171
-
172
-
173
-
174
-
175
-
176
-
177
-
178
-
179
-
180
-
181
-
182
-
183
-
184
-
185
-
186
-
187
-
188
-
189
-
190
-
191
-
192
-
193
-
194
-
195
-
196
-
197
-
198
-
199
-
200
-
201
-
202
-
203
-
204
-
205
-
206
-
207
-
208
-
209
-
210
-
211
-
212
-
213
-
214
-
215
-
216
-
217
-
218
-
219
-
220
-
221
-
222
-
223
-
224
-
225
-
226
-
227
-
228
-
229
-
230
-
231
-
232
-
233
-
234
-
235
-
236
-
237
-
238
-
239
-
240
 |
 |

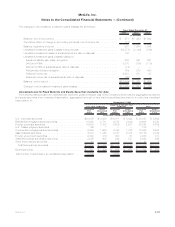
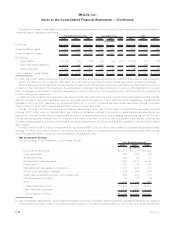
primarily issued by U.S. financial institutions, have cumulative interest deferral features and are commonly referred to as “capital
securities” within U.S. corporate securities.
The Company held foreign currency derivatives with notional amounts of $9.1 billion and $9.2 billion to hedge the exchange rate risk
associated with foreign denominated fixed maturity securities at December 31, 2008 and 2007, respectively.
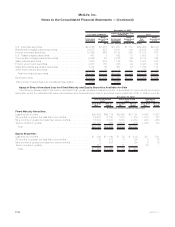
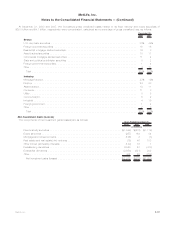
Below Investment Grade or Non Rated Fixed Maturity Securities. The Company held fixed maturity securities at estimated fair values that
were below investment grade or not rated by an independent rating agency that totaled $12.4 billion and $17.4 billion at December 31,
2008 and 2007, respectively. These securities had net unrealized losses of $5,094 million and $103 million at December 31, 2008 and
2007, respectively.
Non-Income Producing Fixed Maturity Securities. Non-income producing fixed maturity securities at estimated fair value were
$75 million and $12 million at December 31, 2008 and 2007, respectively. Net unrealized gains (losses) associated with non-income
producing fixed maturity securities were ($19) million and $11 million at December 31, 2008 and 2007, respectively.
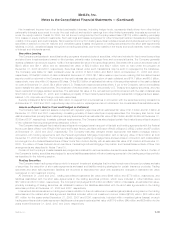
Fixed Maturity Securities Credit Enhanced by Financial Guarantee Insurers. At December 31, 2008, $4.9 billion of the estimated fair
value of the Company’s fixed maturity securities were credit enhanced by financial guarantee insurers of which $2.0 billion, $2.0 billion and
$0.9 billion, are included within state and political subdivision securities, U.S. corporate securities, and asset-backed securities,
respectively, and 15% and 68% were guaranteed by financial guarantee insurers who were Aa and Baa rated, respectively. As described
below, all of the asset-backed securities that are credit enhanced by financial guarantee insurers are asset-backed securities which are
backed by sub-prime mortgage loans.
Concentrations of Credit Risk (Fixed Maturity Securities). The following section contains a summary of the concentrations of credit risk
related to fixed maturity securities holdings.
The Company is not exposed to any concentrations of credit risk of any single issuer greater than 10% of the Company’s stockholders’
equity, other than securities of the U.S. government and certain U.S. government agencies. At December 31, 2008 and 2007, the
Company’s holdings in U.S. Treasury and agency fixed maturity securities at estimated fair value were $21.3 billion and $21.2 billion,
respectively. As shown in the sector table above, at December 31, 2008 the Company’s three largest exposures in its fixed maturity
security portfolio were U.S. corporate fixed maturity securities (33.6%), residential mortgage-backed securities (19.2%), and foreign
corporate securities (15.8%); and at December 31, 2007 were U.S. corporate fixed maturity securities (31.8%), residential mortgage-
backed securities (23.7%), and foreign corporate securities (16.0%).
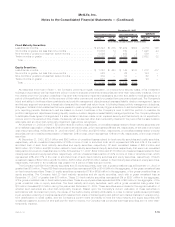
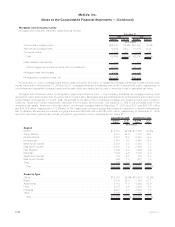
Concentrations of Credit Risk (Fixed Maturity Securities) — U.S. and Foreign Corporate Securities. At December 31, 2008 and 2007,
the Company’s holdings in U.S. corporate and foreign corporate fixed maturity securities at estimated fair value were $93.0 billion and
$111.1 billion, respectively. The Company maintains a diversified portfolio of corporate securities across industries and issuers. The
portfolio does not have exposure to any single issuer in excess of 1% of total invested assets. The exposure to the largest single issuer of
corporate fixed maturity securities held at December 31, 2008 and 2007 was $1.5 billion and $1.2 billion, respectively. At December 31,
2008 and 2007, the Company’s combined holdings in the ten issuers to which it had the greatest exposure totaled $8.4 billion and
$7.8 billion, respectively, the total of these ten issuers being less than 3% of the Company’s total invested assets at such dates. The table
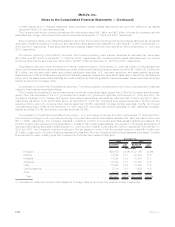
below shows the major industry types that comprise the corporate fixed maturity holdings at:
Estimated
Fair Value %of
Total Estimated
Fair Value %of
Total
2008 2007
December 31,
(In millions)
Foreign(1)............................................. $29,679 32.0% $ 37,166 33.4%
Finance .............................................. 14,996 16.1 20,639 18.6
Industrial.............................................. 13,324 14.3 15,838 14.3
Consumer............................................. 13,122 14.1 15,793 14.2
Utility................................................ 12,434 13.4 13,206 11.9
Communications......................................... 5,714 6.1 7,679 6.9
Other................................................ 3,713 4.0 764 0.7
Total . . . . . . . . . . . . . . . . . . . . . . . . . . . . . . . . . . . . . . . . . . . . . . . $92,982 100.0% $111,085 100.0%
(1) Includes U.S. dollar-denominated debt obligations of foreign obligors, and other fixed maturity foreign investments.
F-30 MetLife, Inc.
MetLife, Inc.
Notes to the Consolidated Financial Statements — (Continued)