MetLife 2008 Annual Report Download - page 93
Download and view the complete annual report
Please find page 93 of the 2008 MetLife annual report below. You can navigate through the pages in the report by either clicking on the pages listed below, or by using the keyword search tool below to find specific information within the annual report.-
 1
1 -
2
-
3
-
4
-
5
-
6
-
7
-
8
-
9
-
10
-
11
-
12
-
13
-
14
-
15
-
16
-
17
-
18
-
19
-
20
-
21
-
22
-
23
-
24
-
25
-
26
-
27
-
28
-
29
-
30
-
31
-
32
-
33
-
34
-
35
-
36
-
37
-
38
-
39
-
40
-
41
-
42
-
43
-
44
-
45
-
46
-
47
-
48
-
49
-
50
-
51
-
52
-
53
-
54
-
55
-
56
-
57
-
58
-
59
-
60
-
61
-
62
-
63
-
64
-
65
-
66
-
67
-
68
-
69
-
70
-
71
-
72
-
73
-
74
-
75
-
76
-
77
-
78
-
79
-
80
-
81
-
82
-
 83
83 -
 84
84 -
 85
85 -
 86
86 -
 87
87 -
 88
88 -
 89
89 -
 90
90 -
 91
91 -
 92
92 -
 93
93 -
 94
94 -
 95
95 -
 96
96 -
 97
97 -
 98
98 -
 99
99 -
 100
100 -
 101
101 -
 102
102 -
 103
103 -
104
-
105
-
106
-
107
-
108
-
109
-
110
-
111
-
112
-
113
-
114
-
115
-
116
-
117
-
118
-
119
-
120
-
121
-
122
-
123
-
124
-
125
-
126
-
127
-
128
-
129
-
130
-
131
-
132
-
133
-
134
-
135
-
136
-
137
-
138
-
139
-
140
-
141
-
142
-
143
-
144
-
145
-
146
-
147
-
148
-
149
-
150
-
151
-
152
-
153
-
154
-
155
-
156
-
157
-
158
-
159
-
160
-
161
-
162
-
163
-
164
-
165
-
166
-
167
-
168
-
169
-
170
-
171
-
172
-
173
-
174
-
175
-
176
-
177
-
178
-
179
-
180
-
181
-
182
-
183
-
184
-
185
-
186
-
187
-
188
-
189
-
190
-
191
-
192
-
193
-
194
-
195
-
196
-
197
-
198
-
199
-
200
-
201
-
202
-
203
-
204
-
205
-
206
-
207
-
208
-
209
-
210
-
211
-
212
-
213
-
214
-
215
-
216
-
217
-
218
-
219
-
220
-
221
-
222
-
223
-
224
-
225
-
226
-
227
-
228
-
229
-
230
-
231
-
232
-
233
-
234
-
235
-
236
-
237
-
238
-
239
-
240
 |
 |

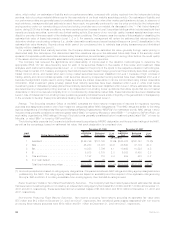
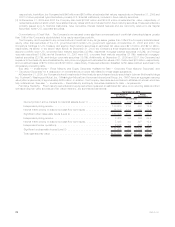
b) Net transfers in and/or out of Level 3 for fixed maturity securities were $1,839 million for the year ended December 31, 2008 and
were comprised of transfers in of $3,522 million and transfers out of ($1,683) million. Net transfers in and/or out of Level 3 for
equity securities were ($29) million for the year ended December 31, 2008 and were comprised of transfers in of $38 million and
transfers out of ($67) million.
c) Included in earnings and other comprehensive income (loss) in the above table, that were incurred for transfers in subsequent to
their transfer to Level 3 were ($479) million and ($723) million, respectively, for fixed maturity securities, and ($20) million and
($3) million, respectively, for equity securities, for the year ended December 31, 2008.
d) Overall, transfers in and/or out of Level 3 are attributable to a change in the observability of inputs. During the year ended
December 31, 2008, fixed maturity securities transfers into Level 3 of $3,522 million resulted primarily from current market
conditions characterized by a lack of trading activity, decreased liquidity, fixed maturity securities going into default, and ratings
downgrades (e.g. from investment grade to below investment grade). These current market conditions have resulted in
decreased transparency of valuations, and an increased use of broker quotations and unobservable inputs to determine fair
value. During the year ended December 31, 2008, fixed maturity securities transfers out of Level 3 of ($1,683) million resulted
primarily from increased transparency of both new issuances that subsequent to issuance and establishment of trading activity
became priced by pricing services and existing issuances that, over time, the Company was able to corroborate pricing
received from independent pricing services with observable inputs.
See “— Summary of Critical Accounting Estimates — Investments” for further information on the estimates and assumptions that affect
the amounts reported above.
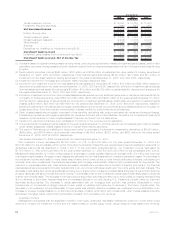
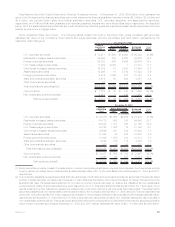
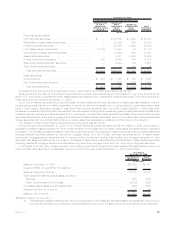
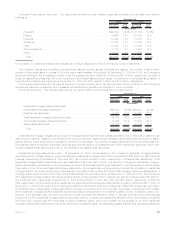
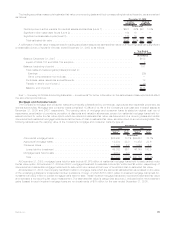
Net Unrealized Investment Gains (Losses). The components of net unrealized investment gains (losses), included in accumulated
other comprehensive income (loss), are as follows:
2008 2007 2006
Years Ended December 31,
(In millions)
Fixed maturity securities . . . . . . . . . . . . . . . . . . . . . . . . . . . . . . . . . . . . . . . . . . $(21,246) $ 3,479 $ 5,075
Equitysecurities............................................... (934) 159 541
Derivatives .................................................. (2) (373) (208)
Minorityinterest............................................... (10) (150) (159)
Other...................................................... 53 3 9
Subtotal................................................... (22,139) 3,118 5,258
Amounts allocated from:
Insuranceliabilitylossrecognition.................................... 42 (608) (1,149)
DACandVOBA ............................................... 3,025 (327) (189)
Policyholderdividendobligation..................................... — (789) (1,062)
Subtotal................................................... 3,067 (1,724) (2,400)
Deferredincometax ............................................ 6,508 (423) (994)
Subtotal................................................... 9,575 (2,147) (3,394)
Net unrealized investment gains (losses) . . . . . . . . . . . . . . . . . . . . . . . . . . . . . . . $(12,564) $ 971 $ 1,864
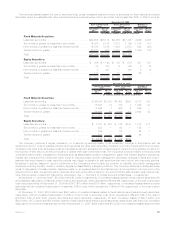
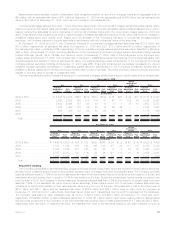
The changes in net unrealized investment gains (losses) are as follows:
2008 2007 2006
Years Ended December 31,
(In millions)
Balance,endofpriorperiod........................................ $ 971 $1,864 $1,942
Cumulative effect of change in accounting principles, net of income tax . . . . . . . . . . . (10) — —
Balance,beginningofperiod....................................... 961 1,864 1,942
Unrealizedinvestmentgains(losses)duringtheyear........................ (25,377) (2,140) (706)
Unrealizedinvestmentlossesofsubsidiariesatthedateofdisposal.............. 130 — —
Unrealized investment gains (losses) relating to:
Insuranceliabilitygain(loss)recognition .............................. 650 541 261
DACandVOBA .............................................. 3,370 (138) (110)
DACandVOBAofsubsidiariesatdateofdisposal........................ (18) — —
Policyholderdividendobligation.................................... 789 273 430
Deferredincometax ........................................... 6,991 571 47
Deferredincometaxofsubsidiariesatdateofdisposal..................... (60) — —
Balance, end of period . . . . . . . . . . . . . . . . . . . . . . . . . . . . . . . . . . . . . . . . . . . $(12,564) $ 971 $1,864
Change in net unrealized investment gains (losses) . . . . . . . . . . . . . . . . . . . . . . . . . $(13,525) $ (893) $ (78)
90 MetLife, Inc.