MetLife 2008 Annual Report Download - page 166
Download and view the complete annual report
Please find page 166 of the 2008 MetLife annual report below. You can navigate through the pages in the report by either clicking on the pages listed below, or by using the keyword search tool below to find specific information within the annual report.-
 1
1 -
2
-
3
-
4
-
5
-
6
-
7
-
8
-
9
-
10
-
11
-
12
-
13
-
14
-
15
-
16
-
17
-
18
-
19
-
20
-
21
-
22
-
23
-
24
-
25
-
26
-
27
-
28
-
29
-
30
-
31
-
32
-
33
-
34
-
35
-
36
-
37
-
38
-
39
-
40
-
41
-
42
-
43
-
44
-
45
-
46
-
47
-
48
-
49
-
50
-
51
-
52
-
53
-
54
-
55
-
56
-
57
-
58
-
59
-
60
-
61
-
62
-
63
-
64
-
65
-
66
-
67
-
68
-
69
-
70
-
71
-
72
-
73
-
74
-
75
-
76
-
77
-
78
-
79
-
80
-
81
-
82
-
83
-
84
-
85
-
86
-
87
-
88
-
89
-
90
-
91
-
92
-
93
-
94
-
95
-
96
-
97
-
98
-
99
-
100
-
101
-
102
-
103
-
104
-
105
-
106
-
107
-
108
-
109
-
110
-
111
-
112
-
113
-
114
-
115
-
116
-
117
-
118
-
119
-
120
-
121
-
122
-
123
-
124
-
125
-
126
-
127
-
128
-
129
-
130
-
131
-
132
-
133
-
134
-
135
-
136
-
137
-
138
-
139
-
140
-
141
-
142
-
143
-
144
-
145
-
146
-
147
-
148
-
149
-
150
-
151
-
152
-
153
-
154
-
155
-
 156
156 -
 157
157 -
 158
158 -
 159
159 -
 160
160 -
 161
161 -
 162
162 -
 163
163 -
 164
164 -
 165
165 -
 166
166 -
 167
167 -
 168
168 -
 169
169 -
 170
170 -
 171
171 -
 172
172 -
 173
173 -
 174
174 -
 175
175 -
 176
176 -
177
-
178
-
179
-
180
-
181
-
182
-
183
-
184
-
185
-
186
-
187
-
188
-
189
-
190
-
191
-
192
-
193
-
194
-
195
-
196
-
197
-
198
-
199
-
200
-
201
-
202
-
203
-
204
-
205
-
206
-
207
-
208
-
209
-
210
-
211
-
212
-
213
-
214
-
215
-
216
-
217
-
218
-
219
-
220
-
221
-
222
-
223
-
224
-
225
-
226
-
227
-
228
-
229
-
230
-
231
-
232
-
233
-
234
-
235
-
236
-
237
-
238
-
239
-
240
 |
 |

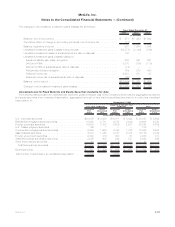
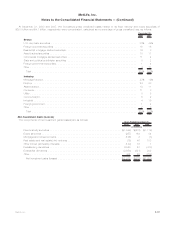
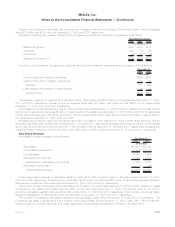
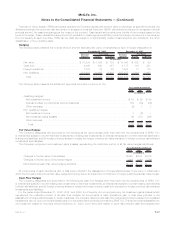
Leveraged Leases
Investment in leveraged leases, included in other invested assets, consisted of the following:
2008 2007
December 31,
(In millions)
Rentalreceivables,net .................................................. $1,486 $1,491
Estimatedresidualvalues................................................. 1,913 1,881
Subtotal........................................................... 3,399 3,372
Unearnedincome...................................................... (1,253) (1,313)
Investmentinleveragedleases............................................ $2,146 $2,059
The Company’s deferred income tax liability related to leveraged leases was $1.2 billion and $1.0 billion at December 31, 2008 and
2007, respectively. The rental receivables set forth above are generally due in periodic installments. The payment periods range from one
to 15 years, but in certain circumstances are as long as 30 years.
The components of net income from investment in leveraged leases are as follows:
2008 2007 2006
Years Ended December 31,
(In millions)
Income from investment in leveraged leases (included in net investment income) . . . . . . . . . . . . $116 $ 68 $ 55
Less:Incometaxexpenseonleveragedleases.................................. (40) (24) (18)
Netincomefrominvestmentinleveragedleases................................. $ 76 $44 $37
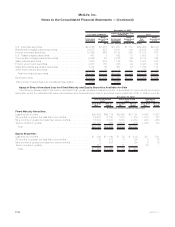
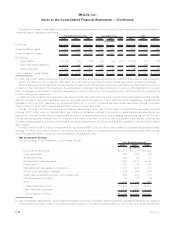
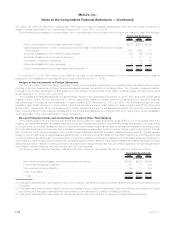
Mortgage Servicing Rights
The following table presents the changes in capitalized mortgage servicing rights for the year ended December 31, 2008:
Carrying Value
(In millions)
Fair value on December 31, 2007 . . . . . . . . . . . . . . . . . . . . . . . . . . . . . . . . . . . . . . . . . . . . . . . $ —
Acquisitionofmortgageservicingrights ........................................... 350
Reductionduetoloanpayments................................................ (10)
Reductionduetosales ...................................................... —
Changes in fair value due to:
Changesinvaluationmodelinputsorassumptions................................... (149)
Otherchangesinfairvalue .................................................. —
Fair value on December 31, 2008 . . . . . . . . . . . . . . . . . . . . . . . . . . . . . . . . . . . . . . . . . . . . . . . $ 191
The Company recognizes the rights to service residential mortgage loans as mortgage servicing rights. MSR’s are either acquired or are
generated from the sale of originated residential mortgage loans where the servicing rights are retained by the Company. MSR’s are carried
at estimated fair value and changes in estimated fair value, primarily due to changes in valuation inputs and assumptions and to the
collection of expected cash flows, are reported in other revenues in theperiodinwhichthechangeoccurs.SeealsoNote24forfurther
information about the how the estimated fair value of mortgage servicing rights is determined and other related information.
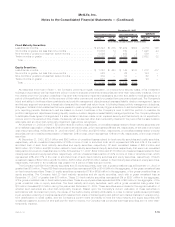
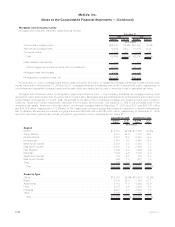
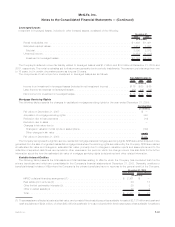
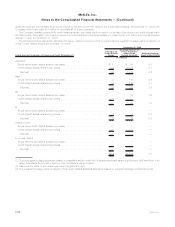
Variable Interest Entities
The following table presents the total assets and total liabilities relating to VIEs for which the Company has concluded that it is the
primary beneficiary and which are consolidated in the Company’s financial statements at December 31, 2008. Generally, creditors or
beneficial interest holders of VIEs where the Company is the primary beneficiary have no recourse to the general credit of the Company.
Total Assets Total Liabilities
December 31, 2008
(In millions)
MRSCcollateralfinancingarrangement(1) ................................ $ 2,361 $ —
Realestatejointventures(2) ......................................... 26 15
Otherlimitedpartnershipinterests(3).................................... 20 3
Otherinvestedassets(4) ........................................... 10 3
Total......................................................... $ 2,417 $ 21
(1) These assets are reflected at estimated fair value, and consist of fixed maturity securities available-for-sale of $2,137 million and cash and
cash equivalents of $224 million, of which $60 million is cash held-in-trust. Included within fixed maturity securities available-for-sale are
F-43MetLife, Inc.
MetLife, Inc.
Notes to the Consolidated Financial Statements — (Continued)