MetLife 2008 Annual Report Download - page 24
Download and view the complete annual report
Please find page 24 of the 2008 MetLife annual report below. You can navigate through the pages in the report by either clicking on the pages listed below, or by using the keyword search tool below to find specific information within the annual report.-
 1
1 -
2
-
3
-
4
-
5
-
6
-
7
-
8
-
9
-
10
-
11
-
12
-
13
-
 14
14 -
 15
15 -
 16
16 -
 17
17 -
 18
18 -
 19
19 -
 20
20 -
 21
21 -
 22
22 -
 23
23 -
 24
24 -
 25
25 -
 26
26 -
 27
27 -
 28
28 -
 29
29 -
 30
30 -
 31
31 -
 32
32 -
 33
33 -
 34
34 -
35
-
36
-
37
-
38
-
39
-
40
-
41
-
42
-
43
-
44
-
45
-
46
-
47
-
48
-
49
-
50
-
51
-
52
-
53
-
54
-
55
-
56
-
57
-
58
-
59
-
60
-
61
-
62
-
63
-
64
-
65
-
66
-
67
-
68
-
69
-
70
-
71
-
72
-
73
-
74
-
75
-
76
-
77
-
78
-
79
-
80
-
81
-
82
-
83
-
84
-
85
-
86
-
87
-
88
-
89
-
90
-
91
-
92
-
93
-
94
-
95
-
96
-
97
-
98
-
99
-
100
-
101
-
102
-
103
-
104
-
105
-
106
-
107
-
108
-
109
-
110
-
111
-
112
-
113
-
114
-
115
-
116
-
117
-
118
-
119
-
120
-
121
-
122
-
123
-
124
-
125
-
126
-
127
-
128
-
129
-
130
-
131
-
132
-
133
-
134
-
135
-
136
-
137
-
138
-
139
-
140
-
141
-
142
-
143
-
144
-
145
-
146
-
147
-
148
-
149
-
150
-
151
-
152
-
153
-
154
-
155
-
156
-
157
-
158
-
159
-
160
-
161
-
162
-
163
-
164
-
165
-
166
-
167
-
168
-
169
-
170
-
171
-
172
-
173
-
174
-
175
-
176
-
177
-
178
-
179
-
180
-
181
-
182
-
183
-
184
-
185
-
186
-
187
-
188
-
189
-
190
-
191
-
192
-
193
-
194
-
195
-
196
-
197
-
198
-
199
-
200
-
201
-
202
-
203
-
204
-
205
-
206
-
207
-
208
-
209
-
210
-
211
-
212
-
213
-
214
-
215
-
216
-
217
-
218
-
219
-
220
-
221
-
222
-
223
-
224
-
225
-
226
-
227
-
228
-
229
-
230
-
231
-
232
-
233
-
234
-
235
-
236
-
237
-
238
-
239
-
240
 |
 |

liabilities associated with a Supreme Court ruling. The Company’s earnings from its investment in Japan decreased due to an increase in
losses on embedded derivatives associated with variable annuity riders, an increase in DAC amortization related to market performance
and the impact of a refinement in assumptions for the guaranteed annuity business partially offset by the favorable impact from the
utilization of the fair value option for certain fixed annuities. The Company’s results were also impacted by a decrease in earnings from
assumed reinsurance, offset by an increase in income from hedging activities associated with Japan’s guaranteed annuity benefits. These
decreases were offset by an increase in net investment gains which was due to an increase from gains on derivatives primarily in Japan
partially offset by losses primarily on fixed maturity investments. There was also an increase in income from continuing operations relating
to Hong Kong associated with the remaining 50% interest in MetLife Fubon acquired in the in the second quarter of 2007.
The Auto & Home segment’s decrease in income from continuing operations was primarily attributable to an increase in net investment
losses and an increase in policyholder benefits and claims. The increase in net investment losses was due to an increase in losses on fixed
maturity and equity securities. The increase in policyholder benefits and claims was comprised primarily of an increase in catastrophe
losses offset by a decrease in non-catastrophe policyholder benefits and claims. Offsetting these decreases was an increase in premiums.
Income from continuing operations for Corporate & Other decreased due to lower net investment income as well as higher corporate
expenses, interest expense, legal costs and interest credited to policyholder account balances. These decreases were offset by an
increase in net investment gains, higher other revenues, lower interest on uncertain tax positions, and lower interest credited to bankholder
deposits. The increase in net investment gains was primarily due to an elimination of losses which were recognized by other segments,
partially offset by losses on fixed maturity securities and derivatives.
Revenues and Expenses
Premiums, Fees and Other Revenues
Premiums, fees and other revenues increased by $3,208 million, or 11%, to $32,881 million for the year ended December 31, 2008
from $29,673 million for the comparable 2007 period.
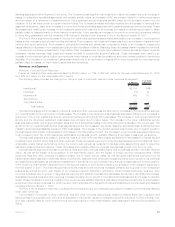
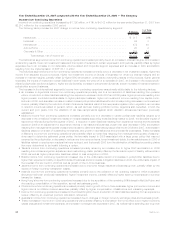
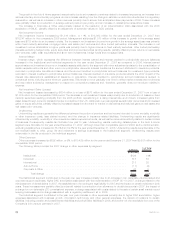
The following table provides the change from the prior year in premiums, fees and other revenues by segment:
$ Change %ofTotal
$ Change
(In millions)
Institutional........................................................ $2,705 84%
Individual ......................................................... (70) (2)
International ....................................................... 468 15
Auto&Home ...................................................... — —
Corporate&Other ................................................... 105 3
Totalchange .................................................. $3,208 100%
The Institutional segment’s increase in premiums, fees and other revenues was primarily due to increases in the retirement & savings,
non-medical health & other and group life businesses. The increase in the retirement & savings business was primarily due to increases in
premiums in the group institutional annuity, structured settlement and global GIC businesses. The increase in both group institutional
annuity and the structured settlement businesses were primarily due to higher sales. The increase in the group institutional annuity
business was primarily due to large domestic sales and the first significant sales in the United Kingdom business in the current year. The
growth in the non-medical health & other business was largely due to increases in the dental, disability, accidental death & dismemberment
(“AD&D”), and individual disability insurance (“IDI”) businesses. The increase in the dental business was primarily due to organic growth in
the business and the impact of an acquisition that closed in the first quarter of 2008. The increase in group life business was primarily due
to an increase in term life, which was largely attributable to business growth, partially offset by a decrease in assumed reinsurance.
The Individual segment’s decrease in premiums, fees and other revenues was primarily attributable to decreases in universal life and
investment-type product policy fees and other revenues. These decreases were due to lower average separate account balances due to
unfavorable equity market performance during the current year, as well as revisions to management’s assumptions used to determine
estimated gross profits and margins. These decreases were partially offset by universal life business growth over the prior year.
The International segment’s increase in premiums, fees and other revenues was primarily due to business growth in the Latin America
region, as well as the impact of an acquisition in the Asia Pacific region, and the impact of foreign currency exchange rates. Chile’s
premiums, fees and other revenues increased primarily due to higher annuity sales, as well as higher institutional premiums from its
traditional and bank distribution channels. Mexico’s premiums, fees and other revenues increased primarily due to growth in its individual
and institutional businesses, as well as the reinstatement of premiums from prior periods. Hong Kong’s increase was due to the acquisition
of the remaining 50% interest in MetLife Fubon in the second quarter of 2007 and the resulting consolidation of the operation beginning in
the third quarter of 2007. The United Kingdom’s premiums, fees and other revenues increased primarily due to growth in the reinsurance
business as well as the prior year impact of an unearned premium calculation refinement. South Korea’s premiums, fees and other
revenues increased due to growth in its guaranteed annuity and variable universal life businesses, as well as in its traditional business.
Australia’s premiums, fees and other revenues increased primarily due to growth in the institutional business and an increase in retention
levels. These increases in premiums, fees and other revenues were partially offset by a decrease in Argentina primarily due to a decrease in
premiums in the pension business, for which pension reform eliminated the obligation of plan administrators to provide death and disability
coverage effective January 1, 2008.
The Auto & Home segment reflected no change when compared to the prior year although a slight increase in premiums was offset by
lower other revenues.
The increase in Corporate & Other premiums, fees and other revenues was primarily related to MetLife Bank loan origination and
servicing fees from acquisitions in 2008 and an adjustment of surrender values on corporate-owned life insurance (“COLI”) policies in the
prior year, partially offset by lower revenue from a prior year resolution of an indemnification claim associated with the 2000 acquisition of
GALIC.
21MetLife, Inc.