MetLife 2008 Annual Report Download - page 220
Download and view the complete annual report
Please find page 220 of the 2008 MetLife annual report below. You can navigate through the pages in the report by either clicking on the pages listed below, or by using the keyword search tool below to find specific information within the annual report.-
 1
1 -
2
-
3
-
4
-
5
-
6
-
7
-
8
-
9
-
10
-
11
-
12
-
13
-
14
-
15
-
16
-
17
-
18
-
19
-
20
-
21
-
22
-
23
-
24
-
25
-
26
-
27
-
28
-
29
-
30
-
31
-
32
-
33
-
34
-
35
-
36
-
37
-
38
-
39
-
40
-
41
-
42
-
43
-
44
-
45
-
46
-
47
-
48
-
49
-
50
-
51
-
52
-
53
-
54
-
55
-
56
-
57
-
58
-
59
-
60
-
61
-
62
-
63
-
64
-
65
-
66
-
67
-
68
-
69
-
70
-
71
-
72
-
73
-
74
-
75
-
76
-
77
-
78
-
79
-
80
-
81
-
82
-
83
-
84
-
85
-
86
-
87
-
88
-
89
-
90
-
91
-
92
-
93
-
94
-
95
-
96
-
97
-
98
-
99
-
100
-
101
-
102
-
103
-
104
-
105
-
106
-
107
-
108
-
109
-
110
-
111
-
112
-
113
-
114
-
115
-
116
-
117
-
118
-
119
-
120
-
121
-
122
-
123
-
124
-
125
-
126
-
127
-
128
-
129
-
130
-
131
-
132
-
133
-
134
-
135
-
136
-
137
-
138
-
139
-
140
-
141
-
142
-
143
-
144
-
145
-
146
-
147
-
148
-
149
-
150
-
151
-
152
-
153
-
154
-
155
-
156
-
157
-
158
-
159
-
160
-
161
-
162
-
163
-
164
-
165
-
166
-
167
-
168
-
169
-
170
-
171
-
172
-
173
-
174
-
175
-
176
-
177
-
178
-
179
-
180
-
181
-
182
-
183
-
184
-
185
-
186
-
187
-
188
-
189
-
190
-
191
-
192
-
193
-
194
-
195
-
196
-
197
-
198
-
199
-
200
-
201
-
202
-
203
-
204
-
205
-
206
-
207
-
208
-
209
-
 210
210 -
 211
211 -
 212
212 -
 213
213 -
 214
214 -
 215
215 -
 216
216 -
 217
217 -
 218
218 -
 219
219 -
 220
220 -
 221
221 -
 222
222 -
 223
223 -
 224
224 -
 225
225 -
 226
226 -
 227
227 -
 228
228 -
 229
229 -
 230
230 -
231
-
232
-
233
-
234
-
235
-
236
-
237
-
238
-
239
-
240
 |
 |

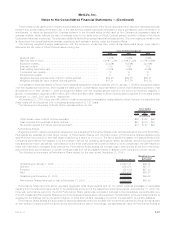
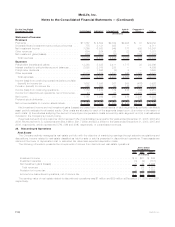
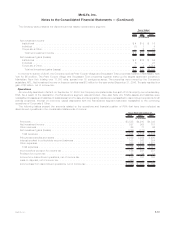
The following table presents the discontinued real estate operations by segment:
2008 2007 2006
Years Ended
December 31,
(In millions)
Net investment income
Institutional ........................................................... $4 $ 9 $ 15
Individual............................................................. (1) 1 4
Corporate&Other....................................................... — 2 73
Totalnetinvestmentincome ............................................... $3 $12 $ 92
Net investment gains (losses)
Institutional ........................................................... $2 $12 $ 58
Individual............................................................. 6 — 23
Corporate&Other....................................................... — 1 4,714
Totalnetinvestmentgains(losses)........................................... $8 $13 $4,795
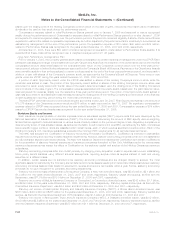
In the fourth quarter of 2006, the Company sold its Peter Cooper Village and Stuyvesant Town properties located in Manhattan, New
York for $5.4 billion. The Peter Cooper Village and Stuyvesant Town properties together make up the largest apartment complex in
Manhattan, New York totaling over 11,000 units, spread over 80 contiguous acres. The properties were owned by the Company’s
subsidiary, MTL. Net investment income on these properties was $73 million for the year ended December 31, 2006. The sale resulted in a
gain of $3 billion, net of income tax.
Operations
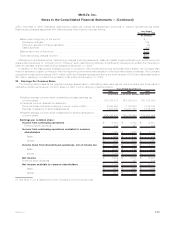
As more fully described in Note 2, on September 12, 2008, the Company completed a tax-free split-off of its majority-owned subsidiary,
RGA. As a result of the disposition, the Reinsurance segment was eliminated. (See also Note 22). RGA’s assets and liabilities were
reclassified to assets and liabilities of subsidiaries held-for-sale and its operating results were reclassified to discontinued operations for all
periods presented. Interest on economic capital associated with the Reinsurance segment has been reclassified to the continuing
operations of Corporate & Other.
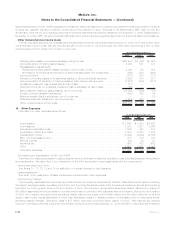
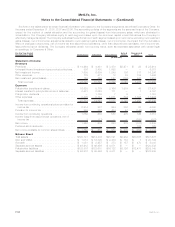
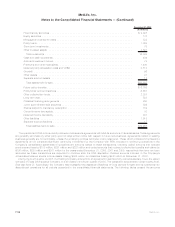
The following tables present the amounts related to the operations and financial position of RGA that have been reflected as
discontinued operations in the consolidated statements of income:
2008 2007 2006
Years Ended December 31,
(In millions)
Premiums.......................................................... $3,535 $4,910 $4,348
Netinvestmentincome ................................................. 597 908 781
Otherrevenues...................................................... 69 77 66
Netinvestmentgains(losses)............................................. (249) (177) 7
Totalrevenues ..................................................... 3,952 5,718 5,202
Policyholderbenefitsandclaims........................................... 2,989 3,989 3,490
Interestcreditedtopolicyholderaccountbalances ............................... 108 262 254
Otherexpenses...................................................... 699 1,226 1,227
Totalexpenses..................................................... 3,796 5,477 4,971
Incomebeforeprovisionforincometax....................................... 156 241 231
Provisionforincometax ................................................ 53 84 81
Incomefromdiscontinuedoperations,netofincometax............................ 103 157 150
Lossondisposal,netofincometax......................................... (458) — —
Income(loss)fromdiscontinuedoperations,netofincometax........................ $ (355) $ 157 $ 150
F-97MetLife, Inc.
MetLife, Inc.
Notes to the Consolidated Financial Statements — (Continued)