MetLife 2008 Annual Report Download - page 31
Download and view the complete annual report
Please find page 31 of the 2008 MetLife annual report below. You can navigate through the pages in the report by either clicking on the pages listed below, or by using the keyword search tool below to find specific information within the annual report.-
 1
1 -
2
-
3
-
4
-
5
-
6
-
7
-
8
-
9
-
10
-
11
-
12
-
13
-
14
-
15
-
16
-
17
-
18
-
19
-
20
-
 21
21 -
 22
22 -
 23
23 -
 24
24 -
 25
25 -
 26
26 -
 27
27 -
 28
28 -
 29
29 -
 30
30 -
 31
31 -
 32
32 -
 33
33 -
 34
34 -
 35
35 -
 36
36 -
 37
37 -
 38
38 -
 39
39 -
 40
40 -
 41
41 -
42
-
43
-
44
-
45
-
46
-
47
-
48
-
49
-
50
-
51
-
52
-
53
-
54
-
55
-
56
-
57
-
58
-
59
-
60
-
61
-
62
-
63
-
64
-
65
-
66
-
67
-
68
-
69
-
70
-
71
-
72
-
73
-
74
-
75
-
76
-
77
-
78
-
79
-
80
-
81
-
82
-
83
-
84
-
85
-
86
-
87
-
88
-
89
-
90
-
91
-
92
-
93
-
94
-
95
-
96
-
97
-
98
-
99
-
100
-
101
-
102
-
103
-
104
-
105
-
106
-
107
-
108
-
109
-
110
-
111
-
112
-
113
-
114
-
115
-
116
-
117
-
118
-
119
-
120
-
121
-
122
-
123
-
124
-
125
-
126
-
127
-
128
-
129
-
130
-
131
-
132
-
133
-
134
-
135
-
136
-
137
-
138
-
139
-
140
-
141
-
142
-
143
-
144
-
145
-
146
-
147
-
148
-
149
-
150
-
151
-
152
-
153
-
154
-
155
-
156
-
157
-
158
-
159
-
160
-
161
-
162
-
163
-
164
-
165
-
166
-
167
-
168
-
169
-
170
-
171
-
172
-
173
-
174
-
175
-
176
-
177
-
178
-
179
-
180
-
181
-
182
-
183
-
184
-
185
-
186
-
187
-
188
-
189
-
190
-
191
-
192
-
193
-
194
-
195
-
196
-
197
-
198
-
199
-
200
-
201
-
202
-
203
-
204
-
205
-
206
-
207
-
208
-
209
-
210
-
211
-
212
-
213
-
214
-
215
-
216
-
217
-
218
-
219
-
220
-
221
-
222
-
223
-
224
-
225
-
226
-
227
-
228
-
229
-
230
-
231
-
232
-
233
-
234
-
235
-
236
-
237
-
238
-
239
-
240
 |
 |

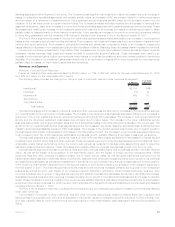
Institutional
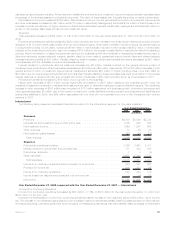
The following table presents consolidated financial information for the Institutional segment for the years indicated:
2008 2007 2006
Years Ended December 31,
(In millions)
Revenues
Premiums................................................... $14,964 $12,392 $11,867
Universallifeandinvestment-typeproductpolicyfees ...................... 886 802 775
Netinvestmentincome .......................................... 7,535 8,176 7,260
Otherrevenues ............................................... 775 726 684
Netinvestmentgains(losses) ...................................... 168 (582) (630)
Totalrevenues .............................................. 24,328 21,514 19,956
Expenses
Policyholderbenefitsandclaims .................................... 16,525 13,805 13,368
Interestcreditedtopolicyholderaccountbalances......................... 2,581 3,094 2,593
Policyholderdividends........................................... — — —
Otherexpenses............................................... 2,408 2,439 2,313
Totalexpenses .............................................. 21,514 19,338 18,274
Incomefromcontinuingoperationsbeforeprovisionforincometax..................... 2,814 2,176 1,682
Provisionforincometax.......................................... 955 740 563
Incomefromcontinuingoperations................................... 1,859 1,436 1,119
Incomefromdiscontinuedoperations,netofincometax..................... 3 13 48
Netincome ................................................ $ 1,862 $ 1,449 $ 1,167
Year Ended December 31, 2008 compared with the Year Ended December 31, 2007 — Institutional
Income from Continuing Operations
Income from continuing operations increased by $423 million, or 29%, to $1,859 million for the year ended December 31, 2008 from
$1,436 million for the comparable 2007 period.
Included in this increase in income from continuing operations was a decrease in net investment losses of $488 million, net of income
tax. The decrease in net investment losses was primarily due to an increase in gains on derivatives partially offset by an increase in losses
from fixed maturity and equity securities, including losses resulting from intersegment transfers of securities. The derivative gains increased
by $1,572 million, net of income tax, and were primarily driven by interest rate swaps, swaptions, and financial futures which were
economic hedges of certain investment assets and institutional liabilities. The remaining change in net investment losses of $1,084 million,
net of income tax, is principally attributable to an increase in losses on fixed maturity and equity securities, and, to a lesser degree, an
increase in losses on mortgage and consumer loans and other limited partnership interests offset by an increase in foreign currency
transaction gains. The increase in losses on fixed maturity and equity securities is primarily attributable to losses on intersegment transfers
of approximately $650 million, net of income tax, which are eliminated within Corporate & Other and to an increase in impairments
associated with financial services industry holdings which experienced losses as a result of bankruptcies, FDIC receivership, and federal
government assisted capital infusion transactions in the third and fourth quarters of 2008, as well as other credit related impairments or
losses on fixed maturity securities where the Company did not intend to hold the securities until recovery in conjunction with overall market
declines occurring throughout the year.
The increase in net investment losses decreased policyholder benefits and claims by $83 million, net of income tax, the majority of
which relates to policyholder participation in the performance of the portfolio.
Excluding the impact from net investment gains (losses), income from continuing operations decreased by $148 million, net of income
tax, compared to the prior year.
Lower underwriting results of $155 million, net of income tax, compared to the prior year, contributed to the decrease in income from
continuing operations. Management attributed this decrease primarily to the group life, non-medical health & other and retirement &
savings businesses of $61 million, $50 million and $47 million, all net of income tax, respectively. Underwriting results are generally the
difference between the portion of premium and fee income intended to cover mortality, morbidity, or other insurance costs less claims
incurred, and the change in insurance-related liabilities. Underwriting results are significantly influenced by mortality, morbidity, or other
insurance-related experience trends, as well as the reinsurance activity related to certain blocks of business. During periods of high
unemployment, underwriting results, specifically in the disability businesses, tend to decrease as incidence levels trend upwards with
unemployment levels and the amount of recoveries decline. In addition, certain insurance-related liabilities can vary as a result of the
valuation of the assets supporting those liabilities. As invested assets under perform or lose value, the related insurance liabilities are
increased to reflect the company’s obligation with respect to those products, specifically certain LTC products. Consequently, underwriting
results can and will fluctuate from period to period.
In addition, a decrease in interest margins of $127 million, net of income tax, compared to the prior year, contributed to the decrease in
income from continuing operations. Management attributed this decrease to the retirement & savings and non-medical health & other
businesses, which contributed $144 million and $71 million, net of income tax, respectively. Partially offsetting these decreases was an
increase in the group life business of $88 million, net of income tax. The decrease in interest margin is primarily attributable to a decline in
net investment income due to lower returns on other limited partnership interests, real estate joint ventures, fixed maturity securities, other
28 MetLife, Inc.