MetLife 2008 Annual Report Download - page 20
Download and view the complete annual report
Please find page 20 of the 2008 MetLife annual report below. You can navigate through the pages in the report by either clicking on the pages listed below, or by using the keyword search tool below to find specific information within the annual report.-
 1
1 -
2
-
3
-
4
-
5
-
6
-
7
-
8
-
9
-
 10
10 -
 11
11 -
 12
12 -
 13
13 -
 14
14 -
 15
15 -
 16
16 -
 17
17 -
 18
18 -
 19
19 -
 20
20 -
 21
21 -
 22
22 -
 23
23 -
 24
24 -
 25
25 -
 26
26 -
 27
27 -
 28
28 -
 29
29 -
 30
30 -
31
-
32
-
33
-
34
-
35
-
36
-
37
-
38
-
39
-
40
-
41
-
42
-
43
-
44
-
45
-
46
-
47
-
48
-
49
-
50
-
51
-
52
-
53
-
54
-
55
-
56
-
57
-
58
-
59
-
60
-
61
-
62
-
63
-
64
-
65
-
66
-
67
-
68
-
69
-
70
-
71
-
72
-
73
-
74
-
75
-
76
-
77
-
78
-
79
-
80
-
81
-
82
-
83
-
84
-
85
-
86
-
87
-
88
-
89
-
90
-
91
-
92
-
93
-
94
-
95
-
96
-
97
-
98
-
99
-
100
-
101
-
102
-
103
-
104
-
105
-
106
-
107
-
108
-
109
-
110
-
111
-
112
-
113
-
114
-
115
-
116
-
117
-
118
-
119
-
120
-
121
-
122
-
123
-
124
-
125
-
126
-
127
-
128
-
129
-
130
-
131
-
132
-
133
-
134
-
135
-
136
-
137
-
138
-
139
-
140
-
141
-
142
-
143
-
144
-
145
-
146
-
147
-
148
-
149
-
150
-
151
-
152
-
153
-
154
-
155
-
156
-
157
-
158
-
159
-
160
-
161
-
162
-
163
-
164
-
165
-
166
-
167
-
168
-
169
-
170
-
171
-
172
-
173
-
174
-
175
-
176
-
177
-
178
-
179
-
180
-
181
-
182
-
183
-
184
-
185
-
186
-
187
-
188
-
189
-
190
-
191
-
192
-
193
-
194
-
195
-
196
-
197
-
198
-
199
-
200
-
201
-
202
-
203
-
204
-
205
-
206
-
207
-
208
-
209
-
210
-
211
-
212
-
213
-
214
-
215
-
216
-
217
-
218
-
219
-
220
-
221
-
222
-
223
-
224
-
225
-
226
-
227
-
228
-
229
-
230
-
231
-
232
-
233
-
234
-
235
-
236
-
237
-
238
-
239
-
240
 |
 |

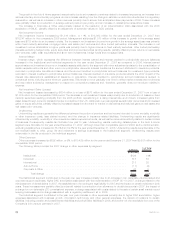
during the years ended December 31, 2008, 2007 and 2006. Increases (decreases) in DAC and VOBA balances, as presented below,
result in a corresponding decrease (increase) in amortization.
2008 2007 2006
Years Ended December 31,
(In millions)
Investmentreturn .................................................. $ 70 $(34) $(50)
Separateaccountbalances............................................ (708) 8 9
Netinvestmentgain(loss)related........................................ (521) 126 233
Expense ........................................................ 61 (53) 45
In-force/Persistency................................................. (159) 1 (34)
Policyholderdividendsandother ........................................ (30) (39) (7)
Total........................................................... $(1,287) $ 9 $196
Prior to 2008, fluctuations in the amounts presented in the table above arose principally from normal assumption reviews during the
period. During 2008, there was a significant increase in DAC and VOBA amortization attributable to the following:
• The decrease in equity markets during the year significantly lowered separate account balances resulting in a significant reduction in
expected future gross profits on variable universal life contracts and variable deferred annuity contracts resulting in an increase of
$708 million in DAC and VOBA amortization.
• Changes in net investment gains (losses) resulted in the following changes in DAC and VOBA amortization:
– Actual gross profits decreased as a result of an increase in liabilities associated with guarantee obligations on variable annuities
resulting in a reduction of DAC and VOBA amortization of $1,047 million. This decrease in actual gross profits was mitigated by
freestanding derivative gains associated with the hedging of such guarantee obligations which resulted in an increase in actual
gross profits and an increase in DAC and VOBA amortization of $625 million.
– A change in valuation of guarantee liabilities, resulting from the adoption of SFAS 157 during 2008, also impacted the computation
of actual gross profits and the related amortization of DAC and VOBA. The addition of risk margins increased the guarantee liability
valuations, decreased actual gross profits and decreased amortization by $100 million. Offsetting this was the addition of own
credit to the valuation of guarantee liabilities. Own credit decreased guarantee liability valuations, increased actual gross profits
and increased amortization by $739 million. The inclusion of the Company’s own credit in the valuation of these guarantee
liabilities’ increases the volatility of these valuations, the relatedDACandVOBAamortization,andthenetincomeoftheCompany.
– As more extensively described in Note 9 of the Notes to the Consolidated Financial Statements, reductions in both actual and
expected cumulative earnings of the closed block resulting from recent experience in the closed block combined with changes in
expected dividend scales resulted in an increase in closed block DAC amortization of $195 million, $175 million of which is related
to net investment gains (losses).
– The remainder of the impact of net investment gains (losses) on DAC amortization of $129 million was attributable to numerous
immaterial items.
• Increases in amortization in 2008 resulting from changes in assumptions related to in-force/persistency of $159 million were driven
by higher than anticipated mortality and lower than anticipated premium persistency during the current year.
The Company’s DAC and VOBA balance is also impacted by unrealized investment gains (losses) and the amount of amortization which
would have been recognized if such gains and losses had been recognized. The significant increase in unrealized investment losses at
December 31, 2008 resulted in an increase in DAC and VOBA of $3.4 billion. Notes 3 and 5 of the Notes to the Consolidated Financial
Statements include the DAC and VOBA offset to unrealized investment losses.
Goodwill
Goodwill is the excess of cost over the estimated fair value of net assets acquired. Goodwill is not amortized but is tested for impairment
at least annually or more frequently if events or circumstances, such as adverse changes in the business climate, indicate that there may
be justification for conducting an interim test. The Company performs its annual goodwill impairment testing during the third quarter of each
year based upon data as of the close of the second quarter.
Impairment testing is performed using the fair value approach, which requires the use of estimates and judgment, at the “reporting unit”
level. A reporting unit is the operating segment or a business one level below the operating segment, if discrete financial information is
prepared and regularly reviewed by management at that level. For purposes of goodwill impairment testing, a significant portion of goodwill
within Corporate & Other is allocated to reporting units within the Company’s business segments.
For purposes of goodwill impairment testing, if the carrying value of a reporting unit’s goodwill exceeds its estimated fair value, there is
an indication of impairment and the implied fair value of the goodwill is determined in the same manner as the amount of goodwill would be
determined in a business acquisition. The excess of the carrying value of goodwill over the implied fair value of goodwill is recognized as an
impairment and recorded as a charge against net income.
In performing its goodwill impairment tests, when management believes meaningful comparable market data are available, the
estimated fair values of the reporting units are determined using a market multiple approach. When relevant comparables are not
available, the Company uses a discounted cash flow model. For reporting units which are particularly sensitive to market assumptions,
such as the annuities and variable & universal life reporting units within the Individual segment, the Company may corroborate its estimated
fair values by using additional valuation methodologies.
The key inputs, judgments and assumptions necessary in determining fair value include projected operating earnings, current book
value (with and without accumulated other comprehensive income), the level of economic capital required to support the mix of business,
long term growth rates, comparative market multiples, the account value of in-force business, projections of new and renewal business as
well as margins on such business, the level of interest rates, credit spreads, equity market levels, and the discount rate management
believes appropriate to the risk associated with the respective reporting unit. The estimated fair value of the annuity and variable & universal
life reporting units are particularly sensitive to the equity market levels.
17MetLife, Inc.