MetLife 2008 Annual Report Download - page 61
Download and view the complete annual report
Please find page 61 of the 2008 MetLife annual report below. You can navigate through the pages in the report by either clicking on the pages listed below, or by using the keyword search tool below to find specific information within the annual report.-
 1
1 -
2
-
3
-
4
-
5
-
6
-
7
-
8
-
9
-
10
-
11
-
12
-
13
-
14
-
15
-
16
-
17
-
18
-
19
-
20
-
21
-
22
-
23
-
24
-
25
-
26
-
27
-
28
-
29
-
30
-
31
-
32
-
33
-
34
-
35
-
36
-
37
-
38
-
39
-
40
-
41
-
42
-
43
-
44
-
45
-
46
-
47
-
48
-
49
-
50
-
 51
51 -
 52
52 -
 53
53 -
 54
54 -
 55
55 -
 56
56 -
 57
57 -
 58
58 -
 59
59 -
 60
60 -
 61
61 -
 62
62 -
 63
63 -
 64
64 -
 65
65 -
 66
66 -
 67
67 -
 68
68 -
 69
69 -
 70
70 -
 71
71 -
72
-
73
-
74
-
75
-
76
-
77
-
78
-
79
-
80
-
81
-
82
-
83
-
84
-
85
-
86
-
87
-
88
-
89
-
90
-
91
-
92
-
93
-
94
-
95
-
96
-
97
-
98
-
99
-
100
-
101
-
102
-
103
-
104
-
105
-
106
-
107
-
108
-
109
-
110
-
111
-
112
-
113
-
114
-
115
-
116
-
117
-
118
-
119
-
120
-
121
-
122
-
123
-
124
-
125
-
126
-
127
-
128
-
129
-
130
-
131
-
132
-
133
-
134
-
135
-
136
-
137
-
138
-
139
-
140
-
141
-
142
-
143
-
144
-
145
-
146
-
147
-
148
-
149
-
150
-
151
-
152
-
153
-
154
-
155
-
156
-
157
-
158
-
159
-
160
-
161
-
162
-
163
-
164
-
165
-
166
-
167
-
168
-
169
-
170
-
171
-
172
-
173
-
174
-
175
-
176
-
177
-
178
-
179
-
180
-
181
-
182
-
183
-
184
-
185
-
186
-
187
-
188
-
189
-
190
-
191
-
192
-
193
-
194
-
195
-
196
-
197
-
198
-
199
-
200
-
201
-
202
-
203
-
204
-
205
-
206
-
207
-
208
-
209
-
210
-
211
-
212
-
213
-
214
-
215
-
216
-
217
-
218
-
219
-
220
-
221
-
222
-
223
-
224
-
225
-
226
-
227
-
228
-
229
-
230
-
231
-
232
-
233
-
234
-
235
-
236
-
237
-
238
-
239
-
240
 |
 |

to $0.2 billion as compared to $0.8 billion in the prior year from short-term, long-term and subordinated debt financings as the mixture and
amount of debt was adjusted in line with the Company’s capital structure plans and market opportunities. In addition, the Company
increased the common stock repurchase program to $1.7 billion in 2007 as compared to the prior year of $0.5 billion in order to
accomplish the Company’s capital structure plans. The Company also paid dividends on its preferred stock and common stock of
$0.7 billion which was $0.1 billion higher than prior year reflecting the increase in the common stock dividend. The remaining decrease in
cash was due to slightly lower net flows on policyholder account balances.
Net cash used in investing activities was $2.7 billion and $10.6 billion for the years ended December 31, 2008 and 2007, respectively.
Accordingly, net cash used in investing activities decreased by $7.9 billion for the year ended December 31, 2008 as compared to the prior
year. The Company reduced the level of cash available for investing activities in 2008 in order to significantly increase cash and cash
equivalents as a liquidity cushion in response to the deterioration in securities markets in 2008. Cash and cash equivalents increased
$13.9 billion at December 31, 2008 compared to the prior year. The net decrease in the amount of cash used in investing activities was
primarily reflected in a decrease in net purchases of fixed maturity and equity securities of $15.8 billion and $2.4 billion, respectively, as
well as a decrease in the net purchases of real estate and real estate joint ventures of $0.5 billion, a decrease in other invested assets of
$0.5 billion and a decrease of $0.5 billion in the net origination of mortgage and consumer loans. In addition, the 2007 period included the
sale of MetLife Australia’s annuities and pension businesses of $0.7 billion. These decreases in net cash used in investing activities were
partially offset by an increase in cash invested in short-term investments of $11.3 billion due to a repositioning from other investment
classes due to volatile market conditions, an increase in net purchases of other limited partnership interests of $0.1 billion and an increase
in policy loans of $0.3 billion. In addition, the 2008 period includes an increase of $0.4 billion of cash used to purchase businesses and the
decrease of $0.3 billion of cash held by a subsidiary, which was split-off from the Company.
Net cash used in investing activities was $10.6 billion and $18.9 billion for the years ended December 31, 2007 and 2006, respectively.
Accordingly, net cash used in investing activities decreased by $8.3 billion for the year ended December 31, 2007 as compared to prior
year. In 2007, cash available for the purchase of invested assets decreased by $11.5 billion as a result of the reduction in cash provided by
financing activities discussed above. Also, partially offsetting this decrease was an increase of $3.3 billion in net cash provided by
operating activities discussed above. The lower amount of cash available for investing activities resulted in a decrease in net purchases of
fixed maturity securities of $15.9 billion, other invested assets of $1.4 billion, and a decrease in net origination of mortgage and consumer
loans of $0.6 billion. This was partially offset by increases in the net purchases of real estate and real estate joint ventures of $6.3 billion,
equity securities of $1.4 billion and other limited partnership interests of $0.8 billion. Also, there was a decrease in cash provided by short-
term investments of $0.5 billion. In addition, the 2007 period includes the sale of MetLife Australia’s annuities and pension businesses and
the acquisition of the remaining 50% interest in MetLife Fubon of $0.7 billion, while the 2006 period includes additional consideration paid
related to purchases of businesses $0.1 billion.
As it relates to cash flows during 2009, the Company anticipates it will pay $30 million in dividends on its series A and series B preferred
shares in March 2009 as announced in February, 2009 and the Company received $1,035 million in cash in connection with the settlement
of the stock purchase contracts as described more fully in “The Holding Company — Liquidity and Capital Sources — Remarketing of
Junior Subordinated Debentures and Settlement of Stock Purchase Contracts.”
The Holding Company
Capital
Restrictions and Limitations on Bank Holding Companies and Financial Holding Companies — Capital. The Holding Company and its
insured depository institution subsidiary, MetLife Bank, are subject to risk-based and leverage capital guidelines issued by the federal
banking regulatory agencies for banks and financial holding companies. The federal banking regulatory agencies are required by law to
take specific prompt corrective actions with respect to institutions that do not meet minimum capital standards. As of their most recently
filed reports with the federal banking regulatory agencies, MetLife, Inc. and MetLife Bank met the minimum capital standards as per federal
banking regulatory agencies with all of MetLife Bank’s risk-based and leverage capital ratios meeting the federal banking regulatory
agencies” “well capitalized” standards and all of MetLife, Inc.’s risk-based and leverage capital ratios meeting the “adequately capitalized”
standards.
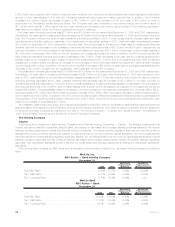
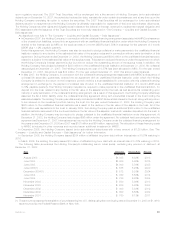
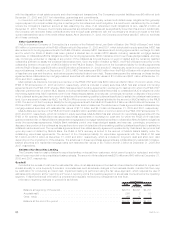
The following table contains the RBC ratios and the regulatory requirements for MetLife, Inc., as a bank holding company, and MetLife
Bank:
MetLife, Inc.
RBC Ratios — Bank Holding Company
December 31,
2008 2007
Regulatory
Requirements
Minimum
Regulatory
Requirements
“Well Capitalized”
TotalRBCRatio................................... 9.52% 9.87% 8.00% 10.00%
Tier1RBCRatio.................................. 9.21% 9.56% 4.00% 6.00%
Tier1LeverageRatio............................... 5.77% 5.56% 4.00% n/a
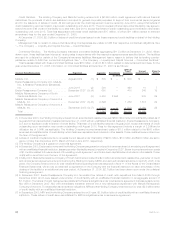
MetLife Bank
RBC Ratios — Bank
December 31,
2008 2007
Regulatory
Requirements
Minimum
Regulatory
Requirements
“Well Capitalized”
TotalRBCRatio................................. 12.32% 12.60% 8.00% 10.00%
Tier1RBCRatio ................................ 11.72% 12.03% 4.00% 6.00%
Tier1LeverageRatio ............................. 6.51% 6.32% 4.00% 5.00%
58 MetLife, Inc.