MetLife 2008 Annual Report Download - page 23
Download and view the complete annual report
Please find page 23 of the 2008 MetLife annual report below. You can navigate through the pages in the report by either clicking on the pages listed below, or by using the keyword search tool below to find specific information within the annual report.-
 1
1 -
2
-
3
-
4
-
5
-
6
-
7
-
8
-
9
-
10
-
11
-
12
-
 13
13 -
 14
14 -
 15
15 -
 16
16 -
 17
17 -
 18
18 -
 19
19 -
 20
20 -
 21
21 -
 22
22 -
 23
23 -
 24
24 -
 25
25 -
 26
26 -
 27
27 -
 28
28 -
 29
29 -
 30
30 -
 31
31 -
 32
32 -
 33
33 -
34
-
35
-
36
-
37
-
38
-
39
-
40
-
41
-
42
-
43
-
44
-
45
-
46
-
47
-
48
-
49
-
50
-
51
-
52
-
53
-
54
-
55
-
56
-
57
-
58
-
59
-
60
-
61
-
62
-
63
-
64
-
65
-
66
-
67
-
68
-
69
-
70
-
71
-
72
-
73
-
74
-
75
-
76
-
77
-
78
-
79
-
80
-
81
-
82
-
83
-
84
-
85
-
86
-
87
-
88
-
89
-
90
-
91
-
92
-
93
-
94
-
95
-
96
-
97
-
98
-
99
-
100
-
101
-
102
-
103
-
104
-
105
-
106
-
107
-
108
-
109
-
110
-
111
-
112
-
113
-
114
-
115
-
116
-
117
-
118
-
119
-
120
-
121
-
122
-
123
-
124
-
125
-
126
-
127
-
128
-
129
-
130
-
131
-
132
-
133
-
134
-
135
-
136
-
137
-
138
-
139
-
140
-
141
-
142
-
143
-
144
-
145
-
146
-
147
-
148
-
149
-
150
-
151
-
152
-
153
-
154
-
155
-
156
-
157
-
158
-
159
-
160
-
161
-
162
-
163
-
164
-
165
-
166
-
167
-
168
-
169
-
170
-
171
-
172
-
173
-
174
-
175
-
176
-
177
-
178
-
179
-
180
-
181
-
182
-
183
-
184
-
185
-
186
-
187
-
188
-
189
-
190
-
191
-
192
-
193
-
194
-
195
-
196
-
197
-
198
-
199
-
200
-
201
-
202
-
203
-
204
-
205
-
206
-
207
-
208
-
209
-
210
-
211
-
212
-
213
-
214
-
215
-
216
-
217
-
218
-
219
-
220
-
221
-
222
-
223
-
224
-
225
-
226
-
227
-
228
-
229
-
230
-
231
-
232
-
233
-
234
-
235
-
236
-
237
-
238
-
239
-
240
 |
 |

Results of Operations
Discussion of Results
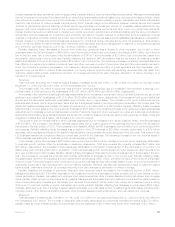
The following table presents consolidated financial information for the Company for the years indicated:
2008 2007 2006
Years Ended December 31,
(In millions)
Revenues
Premiums................................................... $25,914 $22,970 $22,052
Universallifeandinvestment-typeproductpolicyfees...................... 5,381 5,238 4,711
Netinvestmentincome.......................................... 16,296 18,063 16,247
Otherrevenues............................................... 1,586 1,465 1,301
Netinvestmentgains(losses)...................................... 1,812 (578) (1,382)
Totalrevenues ........................................... 50,989 47,158 42,929
Expenses
Policyholderbenefitsandclaims.................................... 27,437 23,783 22,869
Interestcreditedtopolicyholderaccountbalances ........................ 4,787 5,461 4,899
Policyholderdividends .......................................... 1,751 1,723 1,698
Otherexpenses............................................... 11,924 10,429 9,537
Totalexpenses........................................... 45,899 41,396 39,003
Incomefromcontinuingoperationsbeforeprovisionforincometax.............. 5,090 5,762 3,926
Provisionforincometax ......................................... 1,580 1,660 1,016
Incomefromcontinuingoperations .................................. 3,510 4,102 2,910
Income(loss)fromdiscontinuedoperations,netofincometax ................ (301) 215 3,383
Netincome ................................................. 3,209 4,317 6,293
Preferredstockdividends ........................................ 125 137 134
Netincomeavailabletocommonshareholders........................... $ 3,084 $ 4,180 $ 6,159
Year Ended December 31, 2008 compared with the Year Ended December 31, 2007 — The Company
Income from continuing operations decreased by $592 million, or 14%, to $3,510 million for the year ended December 31, 2008 from
$4,102 million for the comparable 2007 period.
The following table provides the change from the prior year in income from continuing operations by segment:
Change
(In millions)
Institutional................................................................ $423
Individual................................................................. (711)
International............................................................... (64)
Auto&Home .............................................................. (161)
Corporate&Other........................................................... (79)
Total change, net of income tax . . . . . . . . . . . . . . . . . . . . . . . . . . . . . . . . . . . . . . . . . . . . . . $(592)
The Institutional segment’s income from continuing operations increased primarily due to a decrease in net investment losses and a
decrease in policyholder benefits due to investment losses shared by policyholders. There was also a decrease in other expenses due in
part to lower expenses related to DAC amortization which is primarily due to the impact of the implementation of SOP 05-1, Accounting by
Insurance Enterprises for Deferred Acquisition Costs in Connection with Modifications or Exchanges of Insurance Contracts (“SOP 05-1”) in
the prior year and amortization refinements in the current year. These increases were offset by lower underwriting results in retirement &
savings, non-medical health & other, and group life businesses. There was also a decrease in interest margins within the retirement &
savings and non-medical health & other businesses, partially offset by an increase in the group life business.
The Individual segment’s income from continuing operations decreased due to higher DAC amortization partially offset by a decrease in
net investment losses due to an increase in gains on freestanding derivatives partially offset by losses primarily relating to embedded
derivatives and fixed maturity securities including those resulting from intersegment transfers of securities. The embedded derivative losses
are net of gains relating to the effect of the widening of the Company’s own credit spread. Income from continuing operations also
decreased due to decreases in interest margins, unfavorable underwriting results in life products, an increase in interest credited to
policyholder account balances, higher annuity benefits, lower universal life and investment-type product policy fees combined with other
revenues, and an increase in policyholder dividends. These decreases were partially offset by a decrease in other expenses as well as an
increase in net investment income on blocks of business not driven by interest margins.
The International segment’s decrease in income from continuing operations was primarily due to a decrease in income from continuing
operations relating to Argentina and Japan. The decrease in Argentina’s income from continuing operations was due to the negative impact
the 2007 pension reform had on current year income from continuing operations. The decrease was partially offset by the net impact
resulting from the Argentine nationalization of the private pension system as well as refinements to certain contingent and insurance
20 MetLife, Inc.