MetLife 2008 Annual Report Download - page 92
Download and view the complete annual report
Please find page 92 of the 2008 MetLife annual report below. You can navigate through the pages in the report by either clicking on the pages listed below, or by using the keyword search tool below to find specific information within the annual report.-
 1
1 -
2
-
3
-
4
-
5
-
6
-
7
-
8
-
9
-
10
-
11
-
12
-
13
-
14
-
15
-
16
-
17
-
18
-
19
-
20
-
21
-
22
-
23
-
24
-
25
-
26
-
27
-
28
-
29
-
30
-
31
-
32
-
33
-
34
-
35
-
36
-
37
-
38
-
39
-
40
-
41
-
42
-
43
-
44
-
45
-
46
-
47
-
48
-
49
-
50
-
51
-
52
-
53
-
54
-
55
-
56
-
57
-
58
-
59
-
60
-
61
-
62
-
63
-
64
-
65
-
66
-
67
-
68
-
69
-
70
-
71
-
72
-
73
-
74
-
75
-
76
-
77
-
78
-
79
-
80
-
81
-
 82
82 -
 83
83 -
 84
84 -
 85
85 -
 86
86 -
 87
87 -
 88
88 -
 89
89 -
 90
90 -
 91
91 -
 92
92 -
 93
93 -
 94
94 -
 95
95 -
 96
96 -
 97
97 -
 98
98 -
 99
99 -
 100
100 -
 101
101 -
 102
102 -
103
-
104
-
105
-
106
-
107
-
108
-
109
-
110
-
111
-
112
-
113
-
114
-
115
-
116
-
117
-
118
-
119
-
120
-
121
-
122
-
123
-
124
-
125
-
126
-
127
-
128
-
129
-
130
-
131
-
132
-
133
-
134
-
135
-
136
-
137
-
138
-
139
-
140
-
141
-
142
-
143
-
144
-
145
-
146
-
147
-
148
-
149
-
150
-
151
-
152
-
153
-
154
-
155
-
156
-
157
-
158
-
159
-
160
-
161
-
162
-
163
-
164
-
165
-
166
-
167
-
168
-
169
-
170
-
171
-
172
-
173
-
174
-
175
-
176
-
177
-
178
-
179
-
180
-
181
-
182
-
183
-
184
-
185
-
186
-
187
-
188
-
189
-
190
-
191
-
192
-
193
-
194
-
195
-
196
-
197
-
198
-
199
-
200
-
201
-
202
-
203
-
204
-
205
-
206
-
207
-
208
-
209
-
210
-
211
-
212
-
213
-
214
-
215
-
216
-
217
-
218
-
219
-
220
-
221
-
222
-
223
-
224
-
225
-
226
-
227
-
228
-
229
-
230
-
231
-
232
-
233
-
234
-
235
-
236
-
237
-
238
-
239
-
240
 |
 |

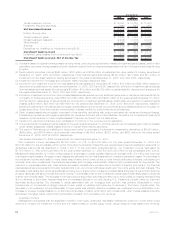
Quoted Prices
in Active
Markets for
Identical Assets
(Level 1)
Significant
Other
Observable
Inputs
(Level 2)
Significant
Unobservable
Inputs
(Level 3)
Total
Estimated
Fair Value
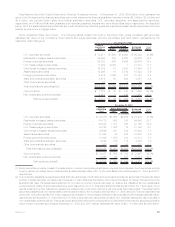
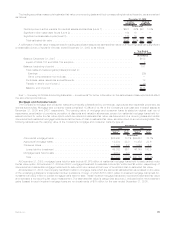
Fair Value Measurements at Reporting Date Using
December 31, 2008
(In millions)
Fixed maturity securities:
U.S.corporatesecurities ......................... $ — $ 55,805 $ 7,498 $ 63,303
Residential mortgage-backed securities . . . . . . . . . . . . . . . . — 35,433 595 36,028
Foreigncorporatesecurities ....................... — 23,735 5,944 29,679
U.S. Treasury/agency securities . . . . . . . . . . . . . . . . . . . . . 10,132 11,090 88 21,310
Commercial mortgage-backed securities . . . . . . . . . . . . . . . — 12,384 260 12,644
Asset-backedsecurities.......................... — 8,071 2,452 10,523
Foreigngovernmentsecurities...................... 282 9,463 408 10,153
State and political subdivision securities . . . . . . . . . . . . . . . — 4,434 123 4,557
Otherfixedmaturitysecurities ...................... — 14 40 54
Total fixed maturity securities . . . . . . . . . . . . . . . . . . . . . $10,414 $160,429 $17,408 $188,251
Equity securities:
Commonstock................................ $ 413 $ 1,167 $ 105 $ 1,685
Non-redeemablepreferredstock .................... — 238 1,274 1,512
Totalequitysecurities.......................... $ 413 $ 1,405 $ 1,379 $ 3,197
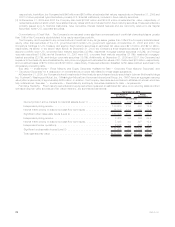
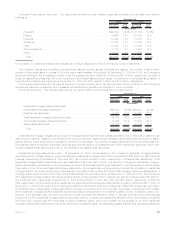
Composition and pricing source for significant Level 3 fixed maturity and equity securities are as follows:
As shown above, the majority of the Level 3 fixed maturity and equity securities (91%) are concentrated in four of the sectors shown
above, U.S. and foreign corporate securities, asset-backed securities and non-redeemable preferred securities. The pricing sources for
these sectors are as follows at December 31, 2008:
Level 3 fixed maturity securities are priced principally through independent broker quotations or market standard valuation method-
ologies using inputs that are not market observable or cannot be derived principally from or corroborated by observable market data.
Level 3 fixed maturity securities consists of less liquid fixed maturity securities with very limited trading activity or where less price
transparency exists around the inputs to the valuation methodologies including below investment grade private placements and less liquid
investment grade corporate securities (included in U.S. and foreign corporate securities) and less liquid asset-backed securities including
securities supported by sub-prime mortgage loans (included in asset-backed securities). Level 3 non-redeemable preferred securities
include securities with very limited trading activity or where less price transparency exists around the inputs to the valuation.
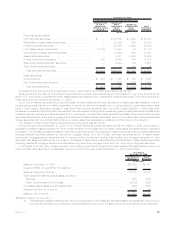
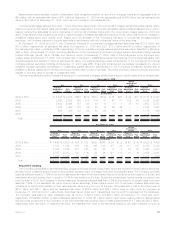
The change in Level 3 fixed maturity securities during the period was as follows:
During the year ended December 31, 2008, Level 3 fixed maturity securities decreased by $5,910 million or 25%, due primarily to
increased unrealized losses recognized in other comprehensive income (loss) and to a lesser extent sales and settlements in excess of
purchases. The increased unrealized losses in fixed maturity securities were concentrated in asset-backed securities (including residential
mortgage-backed securities backed by sub-prime mortgage loans), U.S. and foreign corporate securities and to a lesser extent
commercial mortgage-backed securities due to current market conditions including less liquidity and increased spreads for such
securities. Net sales and settlements in excess of purchases of fixed maturity securities were concentrated in asset-backed securities
(including residential mortgage-backed securities backed by sub-prime mortgage loans) and U.S. and foreign corporate securities.
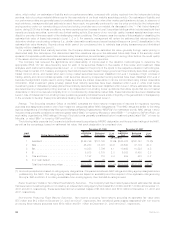
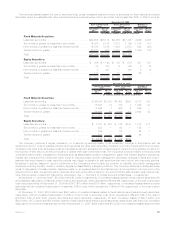
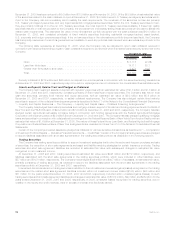
A rollforward of the fair value measurements for fixed maturity securities and equity securities measured at estimated fair value on a
recurring basis using significant unobservable (Level 3) inputs for the year ended December 31, 2008 is as follows:
Fixed Maturity
Securities Equity
Securities
Year Ended
December 31, 2008
(In millions)
Balance, December 31, 2007 . . . . . . . . . . . . . . . . . . . . . . . . . . . . . . . . . . . . . . . . . . $23,326 $2,371
ImpactofSFAS157andSFAS159adoption ................................ (8) —
Balance,beginningofperiod........................................... 23,318 2,371
Total realized/unrealized gains (losses) included in:
Earnings....................................................... (881) (197)
Othercomprehensiveincome(loss)..................................... (6,272) (478)
Purchases,sales,issuancesandsettlements................................ (596) (288)
Transferinand/oroutofLevel3......................................... 1,839 (29)
Balance,endofperiod............................................... $17,408 $1,379
Transfers in and/or out of Level 3 —
a) Total gains and losses (in earnings and other comprehensive income (loss)) are calculated assuming transfers in (out) of Level 3
occurred at the beginning of the period. Items transferred in and out in the same period are excluded from the rollforward.
89MetLife, Inc.