MetLife 2008 Annual Report Download - page 161
Download and view the complete annual report
Please find page 161 of the 2008 MetLife annual report below. You can navigate through the pages in the report by either clicking on the pages listed below, or by using the keyword search tool below to find specific information within the annual report.-
 1
1 -
2
-
3
-
4
-
5
-
6
-
7
-
8
-
9
-
10
-
11
-
12
-
13
-
14
-
15
-
16
-
17
-
18
-
19
-
20
-
21
-
22
-
23
-
24
-
25
-
26
-
27
-
28
-
29
-
30
-
31
-
32
-
33
-
34
-
35
-
36
-
37
-
38
-
39
-
40
-
41
-
42
-
43
-
44
-
45
-
46
-
47
-
48
-
49
-
50
-
51
-
52
-
53
-
54
-
55
-
56
-
57
-
58
-
59
-
60
-
61
-
62
-
63
-
64
-
65
-
66
-
67
-
68
-
69
-
70
-
71
-
72
-
73
-
74
-
75
-
76
-
77
-
78
-
79
-
80
-
81
-
82
-
83
-
84
-
85
-
86
-
87
-
88
-
89
-
90
-
91
-
92
-
93
-
94
-
95
-
96
-
97
-
98
-
99
-
100
-
101
-
102
-
103
-
104
-
105
-
106
-
107
-
108
-
109
-
110
-
111
-
112
-
113
-
114
-
115
-
116
-
117
-
118
-
119
-
120
-
121
-
122
-
123
-
124
-
125
-
126
-
127
-
128
-
129
-
130
-
131
-
132
-
133
-
134
-
135
-
136
-
137
-
138
-
139
-
140
-
141
-
142
-
143
-
144
-
145
-
146
-
147
-
148
-
149
-
150
-
 151
151 -
 152
152 -
 153
153 -
 154
154 -
 155
155 -
 156
156 -
 157
157 -
 158
158 -
 159
159 -
 160
160 -
 161
161 -
 162
162 -
 163
163 -
 164
164 -
 165
165 -
 166
166 -
 167
167 -
 168
168 -
 169
169 -
 170
170 -
 171
171 -
172
-
173
-
174
-
175
-
176
-
177
-
178
-
179
-
180
-
181
-
182
-
183
-
184
-
185
-
186
-
187
-
188
-
189
-
190
-
191
-
192
-
193
-
194
-
195
-
196
-
197
-
198
-
199
-
200
-
201
-
202
-
203
-
204
-
205
-
206
-
207
-
208
-
209
-
210
-
211
-
212
-
213
-
214
-
215
-
216
-
217
-
218
-
219
-
220
-
221
-
222
-
223
-
224
-
225
-
226
-
227
-
228
-
229
-
230
-
231
-
232
-
233
-
234
-
235
-
236
-
237
-
238
-
239
-
240
 |
 |

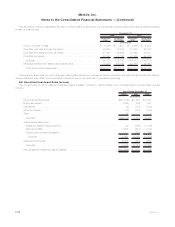
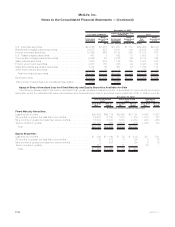
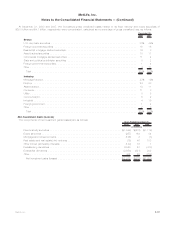
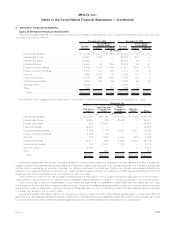
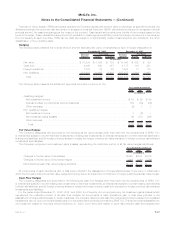
Proceeds from sales or disposals of fixed maturity and equity securities and the components of fixed maturity and equity securities net
investment gains (losses) are as follows:
2008 2007 2006 2008 2007 2006 2008 2007 2006
Fixed Maturity Securities Equity Securities Total
(In millions)
Proceeds . . . . . . . . . . . . . . . . . . . $62,495 $78,001 $86,725 $2,107 $1,112 $845 $64,602 $79,113 $87,570
Gross investment gains . . . . . . . . . . 858 554 421 436 226 130 1,294 780 551
Gross investment losses . . . . . . . . . . (1,511) (1,091) (1,484) (263) (43) (22) (1,774) (1,134) (1,506)
Writedowns..................
Credit-related . . . . . . . . . . . . . . (1,138) (58) (56) (90) (19) (24) (1,228) (77) (80)
Other than credit-related(1) . . . . . (158) (20) — (340) — — (498) (20) —
Total writedowns . . . . . . . . . . . . (1,296) (78) (56) (430) (19) (24) (1,726) (97) (80)
Net investment gains (losses) . . . . . $ (1,949) $ (615) $ (1,119) $ (257) $ 164 $ 84 $ (2,206) $ (451) $ (1,035)
(1) Other-than credit-related writedowns include items such as equity securities where the primary reason for the writedown was the severity
and/or the duration of an unrealized loss position and fixed maturity securities where an interest-rate related writedown was taken.
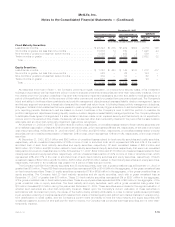
The Company periodically disposes of fixed maturity and equity securities at a loss. Generally, such losses are insignificant in amount or
in relation to the cost basis of the investment, are attributable to declines in fair value occurring in the period of the disposition or are as a
result of management’s decision to sell securities based on current conditions or the Company’s need to shift the portfolio to maintain its
portfolio management objectives.
Losses from fixed maturity and equity securities deemed other-than-temporarily impaired, included within net investment gains (losses),
were $1,726 million, $97 million and $80 million for the years ended December 31, 2008, 2007 and 2006, respectively. The substantial
increase in 2008 over 2007 was driven by writedowns totaling $1,014 million of financial services industry securities holdings, comprised
of $673 million of fixed maturity securities and $341 million of equity securities.
Overall, of the $1,296 million of fixed maturity security writedowns in 2008, $673 million were on financial services industry services
holdings; $241 million were on communication and consumer industries holdings; $164 million on asset-backed (substantially all are
backed by or exposed to sub-prime mortgage loans) and below investment grade commercial mortgage-backed holdings; and $218 million
in fixed maturity security holdings that the Company either lacked the intent to hold, or due to extensive credit spread widening, the
Company was uncertain of its intent to hold these fixed maturity securities for a period of time sufficient to allow for recovery of the market
value decline.
Included within the $430 million of writedowns on equity securities in 2008 are $341 million related to the financial services industry
holdings, (of which, $90 million related to the financial services industry non-redeemable preferred securities) and $89 million across
several industries including consumer, communications, industrial and utility.
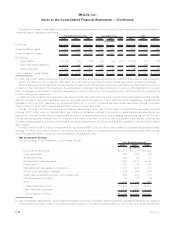
Net Investment Income
The components of net investment income are as follows:
2008 2007 2006
Years Ended December 31,
(In millions)
Fixedmaturitysecurities ......................................... $13,577 $14,576 $13,523
Equitysecurities .............................................. 258 265 106
Tradingsecurities.............................................. (193) 50 71
Mortgageandconsumerloans..................................... 2,855 2,811 2,488
Policyloans ................................................. 601 572 547
Realestateandrealestatejointventures .............................. 581 950 777
Otherlimitedpartnershipinterests................................... (170) 1,309 945
Cash,cashequivalentsandshort-terminvestments ....................... 353 491 513
Internationaljointventures(1) ...................................... 43 17 (9)
Other ..................................................... 349 320 269
Totalinvestmentincome........................................ 18,254 21,361 19,230
Less:Investmentexpenses ....................................... 1,958 3,298 2,983
Netinvestmentincome......................................... $16,296 $18,063 $16,247
(1) Net of changes in estimated fair value of derivatives related to economic hedges of these equity method investments that do not qualify for
hedge accounting of $178 million, $12 million and ($40) million for the years ended December 31, 2008, 2007 and 2006, respectively.
F-38 MetLife, Inc.
MetLife, Inc.
Notes to the Consolidated Financial Statements — (Continued)