MetLife 2008 Annual Report Download - page 87
Download and view the complete annual report
Please find page 87 of the 2008 MetLife annual report below. You can navigate through the pages in the report by either clicking on the pages listed below, or by using the keyword search tool below to find specific information within the annual report.-
 1
1 -
2
-
3
-
4
-
5
-
6
-
7
-
8
-
9
-
10
-
11
-
12
-
13
-
14
-
15
-
16
-
17
-
18
-
19
-
20
-
21
-
22
-
23
-
24
-
25
-
26
-
27
-
28
-
29
-
30
-
31
-
32
-
33
-
34
-
35
-
36
-
37
-
38
-
39
-
40
-
41
-
42
-
43
-
44
-
45
-
46
-
47
-
48
-
49
-
50
-
51
-
52
-
53
-
54
-
55
-
56
-
57
-
58
-
59
-
60
-
61
-
62
-
63
-
64
-
65
-
66
-
67
-
68
-
69
-
70
-
71
-
72
-
73
-
74
-
75
-
76
-
 77
77 -
 78
78 -
 79
79 -
 80
80 -
 81
81 -
 82
82 -
 83
83 -
 84
84 -
 85
85 -
 86
86 -
 87
87 -
 88
88 -
 89
89 -
 90
90 -
 91
91 -
 92
92 -
 93
93 -
 94
94 -
 95
95 -
 96
96 -
 97
97 -
98
-
99
-
100
-
101
-
102
-
103
-
104
-
105
-
106
-
107
-
108
-
109
-
110
-
111
-
112
-
113
-
114
-
115
-
116
-
117
-
118
-
119
-
120
-
121
-
122
-
123
-
124
-
125
-
126
-
127
-
128
-
129
-
130
-
131
-
132
-
133
-
134
-
135
-
136
-
137
-
138
-
139
-
140
-
141
-
142
-
143
-
144
-
145
-
146
-
147
-
148
-
149
-
150
-
151
-
152
-
153
-
154
-
155
-
156
-
157
-
158
-
159
-
160
-
161
-
162
-
163
-
164
-
165
-
166
-
167
-
168
-
169
-
170
-
171
-
172
-
173
-
174
-
175
-
176
-
177
-
178
-
179
-
180
-
181
-
182
-
183
-
184
-
185
-
186
-
187
-
188
-
189
-
190
-
191
-
192
-
193
-
194
-
195
-
196
-
197
-
198
-
199
-
200
-
201
-
202
-
203
-
204
-
205
-
206
-
207
-
208
-
209
-
210
-
211
-
212
-
213
-
214
-
215
-
216
-
217
-
218
-
219
-
220
-
221
-
222
-
223
-
224
-
225
-
226
-
227
-
228
-
229
-
230
-
231
-
232
-
233
-
234
-
235
-
236
-
237
-
238
-
239
-
240
 |
 |

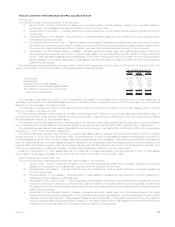
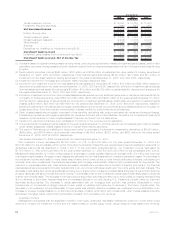
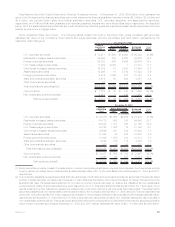
2008 2007 2006
December 31,
(In millions)
Grossinvestmentincome...................................... $ 16,764 $ 18,755 $ 17,020
Investmentfeesandexpenses .................................. (460) (427) (391)
Net Investment Income ..................................... $ 16,304 $ 18,328 $ 16,629
Endingcarryingvalue ........................................ $322,518 $328,009 $314,836
Grossinvestmentgains....................................... $ 2,575 $ 1,386 $ 5,731
Grossinvestmentlosses(8)..................................... (2,005) (1,710) (2,008)
Writedowns(8)............................................. (2,042) (140) (134)
Subtotal................................................. $ (1,472) $ (464) $ 3,589
Derivativesnotqualifyingforhedgeaccounting(8),(9).................... 3,243 (380) (472)
Investment Gains (Losses) ................................... $ 1,771 $ (844) $ 3,117
Investmentgains(losses)incometaxbenefit(provision) .................. (671) 280 (1,114)
Investment Gains (Losses), Net of Income Tax ..................... $ 1,100 $ (564) $ 2,003
(1) Yields are based on quarterly average asset carrying values, excluding recognized and unrealized investment gains (losses), and for yield
calculation purposes, average assets exclude collateral received from counterparties associated with the Company’s securities lending
program.
(2) Fixed maturity securities include $946 million, $779 million and $759 million at estimated fair value related to trading securities at
December 31, 2008, 2007 and 2006, respectively. Fixed maturity securities include ($193) million, $50 million and $71 million of
investment income (loss) related to trading securities for the years ended December 31, 2008, 2007 and 2006, respectively.
(3) Investment income from mortgage and consumer loans includes prepayment fees.
(4) Included in net investment income from real estate and real estate joint ventures is $3 million, $12 million and $92 million related to
discontinued operations for the years ended December 31, 2008, 2007 and 2006, respectively. Included in investment gains (losses)
from real estate and real estate joint ventures is $8 million, $13 million and $4,795 million of gains related to discontinued operations for
the years ended December 31, 2008, 2007 and 2006, respectively.
(5) Included in investment income from other invested assets are scheduled periodic settlement payments on derivative instruments that do
not qualify for hedge accounting under SFAS 133 of $5 million, $253 million and $290 million for the years ended December 31, 2008,
2007 and 2006, respectively. These amounts are excluded from investment gains (losses). Additionally, excluded from investment gains
(losses) is $44 million, $25 million and $6 million for the years ended December 31, 2008, 2007 and 2006, respectively, related to
settlement payments on derivatives used to hedge interest rate and currency risk on policyholder account balances that do not qualify for
hedge accounting. Such amounts are included within interest credited to policyholder account balances.
(6) Other invested assets are principally comprised of free standing derivatives with positive estimated fair values and leveraged leases.
Freestanding derivatives with negative estimated fair values are included within other liabilities. As yield is not considered a meaningful
measure of performance for other invested assets it has been excluded from the table above.
(7) Certain prior period amounts have been reclassified to conform to the current period presentation.
(8) The components of investment gains (losses) for the year ended December 31, 2008 are shown net of a realized gain under purchased
credit default swaps that offsets losses incurred on certain fixed maturity securities.
(9) The caption “Derivatives not qualifying for hedge accounting” is comprised of amounts for freestanding derivatives of $5,893 million,
($59) million, and ($674) million; and embedded derivatives of ($2,650) million, ($321) million, and $202 million for the years ended
December 31, 2008, 2007 and 2006, respectively.
Year Ended December 31, 2008 compared with the Year Ended December 31, 2007
Net investment income decreased by $2,024 million, or 11%, to $16,304 million for the year ended December 31, 2008 from
$18,328 million for the comparable 2007 period. Excluding the impacts of discontinued operations and periodic settlement payments on
derivatives instruments as described in notes 4 and 5 of the yield table presented above, net investment income decreased by
$1,767 million, or 10%, to $16,296 million for the year ended December 31, 2008 from $18,063 million for the comparable 2007 period.
Management attributes $3,141 million of this change to a decrease in yields, partially offset by an increase of $1,374 million due to growth
in average invested assets. Average invested assets are calculated on the cost basis without unrealized gains and losses. The decrease in
net investment income attributable to lower yields was primarily due to lower returns on other limited partnership interests, real estate joint
ventures, short-term investments, fixed maturity securities, and mortgage loans partially offset by improved securities lending results. The
reduction in yields associated with other limited partnership interests were primarily due to the lack of liquidity and credit in the financial
markets as well as unprecedented investor redemptions in an environment with steep declines in the public equity and debt markets. The
decrease in real estate joint ventures yields was primarily due to a slow down in lease and related sales activities in a period with declining
property values as well as fund investment write-downs. The decrease in short-term investment yields was primarily attributable to declines
in short-term interest rates. The decrease in the fixed maturity securities’ yield was primarily due to lower yields on floating rate securities
due to declines in short-term interest rates and an increased allocation to lower yielding U.S. Treasuries, partially offset by improved
securities lending results. The decrease in yields associated with our mortgage loan portfolio was primarily attributable to lower
prepayments on commercial mortgage loans and lower yields on variable rate loans due to declines in short-term interest rates. The
decrease in net investment income attributable to lower yields was partially offset by increased net investment income attributable to an
increase in average invested assets on an amortized cost basis, primarily within short-term investments, other invested assets including
derivatives, mortgage loans, other limited partnership interests, and real estate joint ventures.
Investment Outlook
Management anticipates that the significant volatility in the equity, credit and real estate markets will continue in 2009 which could
continue to impact net investment income and the related yields on private equity funds, hedge funds and real estate joint ventures,
84 MetLife, Inc.