MetLife 2008 Annual Report Download - page 35
Download and view the complete annual report
Please find page 35 of the 2008 MetLife annual report below. You can navigate through the pages in the report by either clicking on the pages listed below, or by using the keyword search tool below to find specific information within the annual report.-
 1
1 -
2
-
3
-
4
-
5
-
6
-
7
-
8
-
9
-
10
-
11
-
12
-
13
-
14
-
15
-
16
-
17
-
18
-
19
-
20
-
21
-
22
-
23
-
24
-
 25
25 -
 26
26 -
 27
27 -
 28
28 -
 29
29 -
 30
30 -
 31
31 -
 32
32 -
 33
33 -
 34
34 -
 35
35 -
 36
36 -
 37
37 -
 38
38 -
 39
39 -
 40
40 -
 41
41 -
 42
42 -
 43
43 -
 44
44 -
 45
45 -
46
-
47
-
48
-
49
-
50
-
51
-
52
-
53
-
54
-
55
-
56
-
57
-
58
-
59
-
60
-
61
-
62
-
63
-
64
-
65
-
66
-
67
-
68
-
69
-
70
-
71
-
72
-
73
-
74
-
75
-
76
-
77
-
78
-
79
-
80
-
81
-
82
-
83
-
84
-
85
-
86
-
87
-
88
-
89
-
90
-
91
-
92
-
93
-
94
-
95
-
96
-
97
-
98
-
99
-
100
-
101
-
102
-
103
-
104
-
105
-
106
-
107
-
108
-
109
-
110
-
111
-
112
-
113
-
114
-
115
-
116
-
117
-
118
-
119
-
120
-
121
-
122
-
123
-
124
-
125
-
126
-
127
-
128
-
129
-
130
-
131
-
132
-
133
-
134
-
135
-
136
-
137
-
138
-
139
-
140
-
141
-
142
-
143
-
144
-
145
-
146
-
147
-
148
-
149
-
150
-
151
-
152
-
153
-
154
-
155
-
156
-
157
-
158
-
159
-
160
-
161
-
162
-
163
-
164
-
165
-
166
-
167
-
168
-
169
-
170
-
171
-
172
-
173
-
174
-
175
-
176
-
177
-
178
-
179
-
180
-
181
-
182
-
183
-
184
-
185
-
186
-
187
-
188
-
189
-
190
-
191
-
192
-
193
-
194
-
195
-
196
-
197
-
198
-
199
-
200
-
201
-
202
-
203
-
204
-
205
-
206
-
207
-
208
-
209
-
210
-
211
-
212
-
213
-
214
-
215
-
216
-
217
-
218
-
219
-
220
-
221
-
222
-
223
-
224
-
225
-
226
-
227
-
228
-
229
-
230
-
231
-
232
-
233
-
234
-
235
-
236
-
237
-
238
-
239
-
240
 |
 |

business associated with the acquisition of Travelers, principally in the structured settlement, pension closeout and general account
businesses.
Higher other expenses of $126 million included an increase in non-deferrable volume-related expenses and corporate support
expenses of $110 million. Non-deferrable volume-related expenses included those expenses associated with direct departmental
spending, information technology, commissions and premium taxes. Corporate support expenses included advertising, corporate over-
head and consulting fees. The increase in other expenses was also attributable to higher DAC amortization of $67 million, primarily due to a
$61 million charge as a result of the ongoing impact of DAC and VOBA amortization resulting from the implementation of SOP 05-1 in 2007.
In addition, a charge of $14 million related to the reimbursement of certain dental claims and a $15 million charge related to the
establishment of a contingent legal liability in 2007 contributed to the increase in other expenses. The impact of certain revisions in both
years also contributed to a net increase in other expenses of $2 million. These increases were partially offset by a $13 million benefit
related to a reduction of an allowance for doubtful accounts in 2007. Additionally, 2006 included the impact of a $22 million charge for non-
deferrable LTC commissions expense, a charge of $24 million associated with costs related to the sale of certain small market
recordkeeping businesses and $24 million related to a regulatory settlement, which reduced other expenses in 2007.
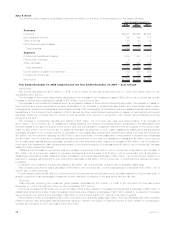
Individual
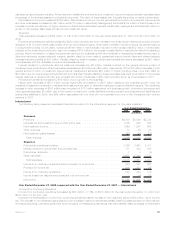
The following table presents consolidated financial information for the Individual segment for the years indicated:
2008 2007 2006
Years Ended December 31,
(In millions)
Revenues
Premiums................................................... $ 4,481 $ 4,481 $ 4,502
Universallifeandinvestment-typeproductpolicyfees...................... 3,400 3,441 3,131
Netinvestmentincome.......................................... 6,509 7,025 6,863
Otherrevenues............................................... 571 600 524
Netinvestmentgains(losses)...................................... 665 (112) (591)
Totalrevenues .............................................. 15,626 15,435 14,429
Expenses
Policyholderbenefitsandclaims.................................... 5,779 5,665 5,335
Interestcreditedtopolicyholderaccountbalances ........................ 2,028 2,013 2,018
Policyholderdividends .......................................... 1,739 1,715 1,696
Otherexpenses............................................... 5,143 4,003 3,485
Totalexpenses.............................................. 14,689 13,396 12,534
Incomefromcontinuingoperationsbeforeprovisionforincometax.............. 937 2,039 1,895
Provisionforincometax ......................................... 307 698 653
Incomefromcontinuingoperations .................................. 630 1,341 1,242
Income(loss)fromdiscontinuedoperations,netofincometax ................ (11) 16 22
Netincome ................................................. $ 619 $ 1,357 $ 1,264
Year Ended December 31, 2008 compared with the Year Ended December 31, 2007 — Individual
Income from Continuing Operations
Income from continuing operations decreased by $711 million, or 53%, to $630 million for the year ended December 31, 2008 from
$1,341 million for the prior year.
Included in this decrease in income from continuing operations was a decrease in net investment losses of $505 million, net of income
tax. The decrease in net investment losses is due to an increase in gains on derivatives partially offset by losses primarily on fixed maturity
securities, including losses resulting from intersegment transfers of securities. Derivative gains were driven by gains on freestanding
derivatives that were partially offset by losses on embedded derivatives primarily associated with variable annuity riders. Gains on
freestanding derivatives increased by $2,308 million, net of income tax, and were primarily driven by: i) gains on certain interest rate floors
and financial futures which were economic hedges of certain investment assets and liabilities, ii) gains from foreign currency derivatives
primarily due to the U.S. dollar strengthening as well as, iii) gains primarily from equity options, financial futures, and interest rate swaps
hedging the embedded derivatives. The gains on these equity options, financial futures, and interest rate swaps substantially offset the
change in the underlying embedded derivative liability that is hedged by these derivatives. Losses on the embedded derivatives increased
by $1,023 million, net of income tax, and were driven by declining interest rates and poor equity market performance throughout the year.
These embedded derivative losses include an $870 million, net of income tax, gain resulting from the effect of the widening of the
Company’s own credit spread which is required to be used in the valuation of these variable annuity rider embedded derivatives under
SFAS 157, which became effective January 1, 2008. The remaining change in net investment losses of $780 million, net of income tax, is
principally attributable to an increase in losses on fixed maturity securities and, to a lesser degree, an increase in foreign currency
transaction losses on mortgage loans. The increase in losses on fixed maturity securities is primarily attributable to losses on intersegment
transfers of approximately $350 million, net of income tax, which are eliminated within Corporate & Other and to impairments associated
with financial services industry holdings which experienced losses as a result of bankruptcies, FDIC receivership, and federal government
assisted capital infusion transactions in the third and fourth quarters of 2008, as well as other credit related impairments or losses on fixed
maturity securities where the Company did not intend to hold the securities until recovery in conjunction with overall market declines
occurring throughout the year.
32 MetLife, Inc.