MetLife 2008 Annual Report Download - page 45
Download and view the complete annual report
Please find page 45 of the 2008 MetLife annual report below. You can navigate through the pages in the report by either clicking on the pages listed below, or by using the keyword search tool below to find specific information within the annual report.-
 1
1 -
2
-
3
-
4
-
5
-
6
-
7
-
8
-
9
-
10
-
11
-
12
-
13
-
14
-
15
-
16
-
17
-
18
-
19
-
20
-
21
-
22
-
23
-
24
-
25
-
26
-
27
-
28
-
29
-
30
-
31
-
32
-
33
-
34
-
 35
35 -
 36
36 -
 37
37 -
 38
38 -
 39
39 -
 40
40 -
 41
41 -
 42
42 -
 43
43 -
 44
44 -
 45
45 -
 46
46 -
 47
47 -
 48
48 -
 49
49 -
 50
50 -
 51
51 -
 52
52 -
 53
53 -
 54
54 -
 55
55 -
56
-
57
-
58
-
59
-
60
-
61
-
62
-
63
-
64
-
65
-
66
-
67
-
68
-
69
-
70
-
71
-
72
-
73
-
74
-
75
-
76
-
77
-
78
-
79
-
80
-
81
-
82
-
83
-
84
-
85
-
86
-
87
-
88
-
89
-
90
-
91
-
92
-
93
-
94
-
95
-
96
-
97
-
98
-
99
-
100
-
101
-
102
-
103
-
104
-
105
-
106
-
107
-
108
-
109
-
110
-
111
-
112
-
113
-
114
-
115
-
116
-
117
-
118
-
119
-
120
-
121
-
122
-
123
-
124
-
125
-
126
-
127
-
128
-
129
-
130
-
131
-
132
-
133
-
134
-
135
-
136
-
137
-
138
-
139
-
140
-
141
-
142
-
143
-
144
-
145
-
146
-
147
-
148
-
149
-
150
-
151
-
152
-
153
-
154
-
155
-
156
-
157
-
158
-
159
-
160
-
161
-
162
-
163
-
164
-
165
-
166
-
167
-
168
-
169
-
170
-
171
-
172
-
173
-
174
-
175
-
176
-
177
-
178
-
179
-
180
-
181
-
182
-
183
-
184
-
185
-
186
-
187
-
188
-
189
-
190
-
191
-
192
-
193
-
194
-
195
-
196
-
197
-
198
-
199
-
200
-
201
-
202
-
203
-
204
-
205
-
206
-
207
-
208
-
209
-
210
-
211
-
212
-
213
-
214
-
215
-
216
-
217
-
218
-
219
-
220
-
221
-
222
-
223
-
224
-
225
-
226
-
227
-
228
-
229
-
230
-
231
-
232
-
233
-
234
-
235
-
236
-
237
-
238
-
239
-
240
 |
 |

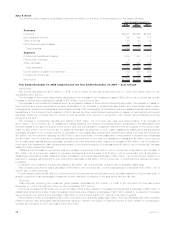
Auto & Home
The following table presents consolidated financial information for the Auto & Home segment for the years indicated:
2008 2007 2006
Years Ended December 31,
(In millions)
Revenues
Premiums..................................................... $2,971 $2,966 $2,924
Netinvestmentincome............................................. 186 196 177
Otherrevenues ................................................. 38 43 22
Netinvestmentgains(losses) ........................................ (135) 15 3
Totalrevenues................................................. 3,060 3,220 3,126
Expenses
Policyholderbenefitsandclaims ...................................... 1,919 1,807 1,717
Policyholderdividends............................................. 5 4 5
Otherexpenses ................................................. 804 829 846
Totalexpenses ................................................ 2,728 2,640 2,568
Incomebeforeprovisionforincometax.................................. 332 580 558
Provisionforincometax............................................ 57 144 142
Netincome.................................................... $ 275 $ 436 $ 416
Year Ended December 31, 2008 compared with the Year Ended December 31, 2007 — Auto & Home
Net Income
Net income decreased by $161 million, or 37%, to $275 million for the year ended December 31, 2008 from $436 million for the
comparable 2007 period.
The decrease in net income was primarily attributable to an increase in net investment losses of $98 million, net of income tax, and an
increase in policyholder benefits and claims of $75 million, net of income tax.
The increase in net investment losses is due to an increase in losses on fixed maturity and equity securities. The increase in losses on
fixed maturity and equity securities is primarily attributable to an increase in impairments associated with financial services industry
holdings which experienced losses as a result of bankruptcies, FDIC receivership, and federal government assisted capital market infusion
transactions in the third and fourth quarters of 2008, as well as other credit related impairments or losses on fixed maturity and equity
securities where the Company did not intend to hold securities until recovery in conjunction with overall market declines occurring
throughout the year.
The increase in policyholder benefits and claims of $75 million, net of income tax, was comprised primarily of an increase of
$134 million, net of income tax, in catastrophe losses resulting from severe thunderstorms and tornadoes in the Midwestern and
Southern states in the second quarter of the current year and hurricanes Ike, Gustav and Hanna in the third quarter of the current year,
offset by $20 million, net of income tax, of additional favorable development of prior years’ catastrophe losses and loss adjustment
expenses, primarily from hurricane Katrina. A decrease in non-catastrophe policyholder benefits and claims improved net income by
$39 million, net of income tax, resulting from $51 million, net of income tax, of lower losses due to lower severity in the auto line of business
and $8 million, net of income tax, of additional favorable development of prior year non-catastrophe losses and $8 million, net of income
tax, in unallocated loss adjustment expenses, primarily from lower employee costs, offset by an increase of $23 million, net of income tax,
from higher non-catastrophe claim frequencies primarily in the homeowners line of business and a $5 million, net of income tax, increase
related to higher earned exposures.
Offsetting this decrease in net income was an increase in premiums of $3 million, net of income tax, comprised of an increase of
$11 million, net of income tax, related to increased exposures and an increase of $16 million, net of income tax, from a decrease in
catastrophe reinsurance costs. Offsetting these increases in premiums was a decrease of $20 million, net of income tax, related to a
reduction in average earned premium per policy and a decrease of $4 million, net of income tax, in premiums from various involuntary
programs.
In addition, net investment income decreased by $6 million, net of income tax, primarily due to a smaller asset base.
Also impacting net income was a decrease of $16 million, net of income tax, in other expenses and a decrease of $3 million, net of
income tax, in other revenues.
Income taxes contributed $2 million to net income over the expected amount primarily due to favorable resolution of a prior year audit. A
greater proportion of tax advantaged investment income resulted in a decline in the segment’s effective tax rate.
Revenues
Total revenues, excluding net investment gains (losses), decreased by $10 million, or 0.3%, to $3,195 million for the year ended
December 31, 2008 from $3,205 million for the comparable 2007 period.
Premiums increased by $5 million due to an increase of $14 million related to increased exposures and a decrease of $25 million in
catastrophe reinsurance costs. These increases in premiums were offset by a decrease of $28 million related to a reduction in average
earned premium per policy and a decrease of $6 million in premiums primarily from various involuntary programs.
Net investment income decreased by $10 million primarily due to a smaller asset base. Other revenues decreased $5 million primarily
related to slower than anticipated claims payments resulting in slower recognition of deferred income in 2008 related to a reinsurance
contract as compared to 2007 and less income from COLI.
42 MetLife, Inc.