MetLife 2008 Annual Report Download - page 90
Download and view the complete annual report
Please find page 90 of the 2008 MetLife annual report below. You can navigate through the pages in the report by either clicking on the pages listed below, or by using the keyword search tool below to find specific information within the annual report.-
 1
1 -
2
-
3
-
4
-
5
-
6
-
7
-
8
-
9
-
10
-
11
-
12
-
13
-
14
-
15
-
16
-
17
-
18
-
19
-
20
-
21
-
22
-
23
-
24
-
25
-
26
-
27
-
28
-
29
-
30
-
31
-
32
-
33
-
34
-
35
-
36
-
37
-
38
-
39
-
40
-
41
-
42
-
43
-
44
-
45
-
46
-
47
-
48
-
49
-
50
-
51
-
52
-
53
-
54
-
55
-
56
-
57
-
58
-
59
-
60
-
61
-
62
-
63
-
64
-
65
-
66
-
67
-
68
-
69
-
70
-
71
-
72
-
73
-
74
-
75
-
76
-
77
-
78
-
79
-
 80
80 -
 81
81 -
 82
82 -
 83
83 -
 84
84 -
 85
85 -
 86
86 -
 87
87 -
 88
88 -
 89
89 -
 90
90 -
 91
91 -
 92
92 -
 93
93 -
 94
94 -
 95
95 -
 96
96 -
 97
97 -
 98
98 -
 99
99 -
 100
100 -
101
-
102
-
103
-
104
-
105
-
106
-
107
-
108
-
109
-
110
-
111
-
112
-
113
-
114
-
115
-
116
-
117
-
118
-
119
-
120
-
121
-
122
-
123
-
124
-
125
-
126
-
127
-
128
-
129
-
130
-
131
-
132
-
133
-
134
-
135
-
136
-
137
-
138
-
139
-
140
-
141
-
142
-
143
-
144
-
145
-
146
-
147
-
148
-
149
-
150
-
151
-
152
-
153
-
154
-
155
-
156
-
157
-
158
-
159
-
160
-
161
-
162
-
163
-
164
-
165
-
166
-
167
-
168
-
169
-
170
-
171
-
172
-
173
-
174
-
175
-
176
-
177
-
178
-
179
-
180
-
181
-
182
-
183
-
184
-
185
-
186
-
187
-
188
-
189
-
190
-
191
-
192
-
193
-
194
-
195
-
196
-
197
-
198
-
199
-
200
-
201
-
202
-
203
-
204
-
205
-
206
-
207
-
208
-
209
-
210
-
211
-
212
-
213
-
214
-
215
-
216
-
217
-
218
-
219
-
220
-
221
-
222
-
223
-
224
-
225
-
226
-
227
-
228
-
229
-
230
-
231
-
232
-
233
-
234
-
235
-
236
-
237
-
238
-
239
-
240
 |
 |

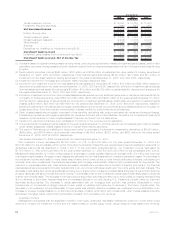
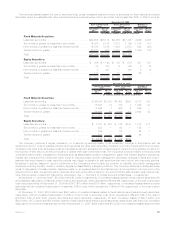
Fixed Maturity Securities Credit Enhanced by Financial Guarantee Insurers. At December 31, 2008, $4.9 billion of the estimated fair
value of the Company’s fixed maturity securities were credit enhanced by financial guarantee insurers of which $2.0 billion, $2.0 billion and
$0.9 billion, are included within state and political subdivision securities, U.S. corporate securities, and asset-backed securities,
respectively, and 15% and 68% were guaranteed by financial guarantee insurers who were Aa and Baa rated, respectively. As described
below, all of the asset-backed securities that are credit enhanced by financial guarantee insurers are asset-backed securities which are
backed by sub-prime mortgage loans.
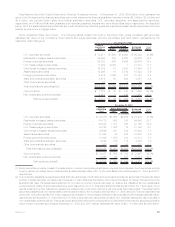
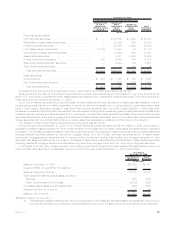
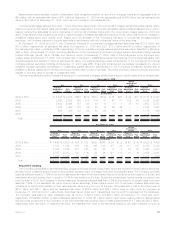
Gross Unrealized Gains and Losses. The following tables present the cost or amortized cost, gross unrealized gain and loss,
estimated fair value of the Company’s fixed maturity and equity securities, and the percentage that each sector represents by the
respective total holdings at:
Cost or
Amortized
Cost Gain Loss Estimated
Fair Value %of
Total
Gross Unrealized
December 31, 2008
(In millions)
U.S.corporatesecurities .......................... $ 72,211 $ 994 $ 9,902 $ 63,303 33.6%
Residential mortgage-backed securities . . . . . . . . . . . . . . . . . 39,995 753 4,720 36,028 19.2
Foreign corporate securities . . . . . . . . . . . . . . . . . . . . . . . . 34,798 565 5,684 29,679 15.8
U.S. Treasury/agency securities . . . . . . . . . . . . . . . . . . . . . . 17,229 4,082 1 21,310 11.3
Commercial mortgage-backed securities . . . . . . . . . . . . . . . . 16,079 18 3,453 12,644 6.7
Asset-backedsecurities........................... 14,246 16 3,739 10,523 5.6
Foreign government securities . . . . . . . . . . . . . . . . . . . . . . . 9,474 1,056 377 10,153 5.4
State and political subdivision securities . . . . . . . . . . . . . . . . 5,419 80 942 4,557 2.4
Otherfixedmaturitysecurities ....................... 57 — 3 54 —
Total fixed maturity securities(2)(3) . . . . . . . . . . . . . . . . . . . . $209,508 $7,564 $28,821 $188,251 100.0%
Commonstock................................. $ 1,778 $ 40 $ 133 $ 1,685 52.7%
Non-redeemable preferred stock(2) . . . . . . . . . . . . . . . . . . . . 2,353 4 845 1,512 47.3
Total equity securities(1) . . . . . . . . . . . . . . . . . . . . . $ 4,131 $ 44 $ 978 $ 3,197 100.0%
Cost or
Amortized
Cost Gain Loss Estimated
Fair Value %of
Total
Gross Unrealized
December 31, 2007
(In millions)
U.S.corporatesecurities ........................... $ 74,310 $1,685 $2,076 $ 73,919 31.8%
Residential mortgage-backed securities . . . . . . . . . . . . . . . . . . 54,773 598 376 54,995 23.7
Foreign corporate securities . . . . . . . . . . . . . . . . . . . . . . . . . 36,232 1,701 767 37,166 16.0
U.S. Treasury/agency securities . . . . . . . . . . . . . . . . . . . . . . . 19,723 1,482 13 21,192 9.1
Commercial mortgage-backed securities . . . . . . . . . . . . . . . . . 16,946 241 194 16,993 7.3
Asset-backedsecurities............................ 11,048 40 516 10,572 4.6
Foreign government securities . . . . . . . . . . . . . . . . . . . . . . . . 11,645 1,350 182 12,813 5.5
State and political subdivision securities . . . . . . . . . . . . . . . . . 4,342 140 114 4,368 1.9
Otherfixedmaturitysecurities........................ 335 13 30 318 0.1
Total fixed maturity securities(2)(3) . . . . . . . . . . . . . . . . . . . . $229,354 $7,250 $4,268 $232,336 100.0%
Commonstock.................................. $ 2,477 $ 568 $ 108 $ 2,937 49.7%
Non-redeemable preferred stock(2) . . . . . . . . . . . . . . . . . . . . 3,255 60 341 2,974 50.3
Total equity securities(1) . . . . . . . . . . . . . . . . . . . . . . $ 5,732 $ 628 $ 449 $ 5,911 100.0%
(1) Equity securities primarily consist of investments in common and preferred stocks and mutual fund interests. Such securities include
common stock of privately held companies with an estimated fair value of $1.1 billion and $569 million at December 31, 2008 and 2007,
respectively.
(2) The Company classifies perpetual securities that have attributes of both debt and equity as fixed maturity securities if the security has a
punitive interest rate step-up feature as it believes in most instances this feature will compel the issuer to redeem the security at the
specified call date. Perpetual securities that do not have a punitive interest rate step-up feature are classified as non-redeemable
preferred stock. Many of such securities have been issued by non-U.S. financial institutions that are accorded Tier 1 and Upper Tier 2
capital treatment by their respective regulatory bodies and are commonly referred to as “perpetual hybrid securities.” Perpetual hybrid
securities classified as non-redeemable preferred stock held by the Company at December 31, 2008 and 2007 had an estimated fair
value of $1,224 million and $2,051 million respectively. In addition, the Company held $288 million and $923 million at estimated fair value,
respectively, at December 31, 2008 and 2007 of other perpetual hybrid securities, primarily U.S. financial institutions, also included in
non-redeemable preferred stock. Perpetual hybrid securities held by the Company and included within fixed maturity securities (primarily
within foreign corporate securities) at December 31, 2008 and 2007 had an estimated fair value of $2,110 million and $3,896 million,
87MetLife, Inc.