MetLife 2008 Annual Report Download - page 46
Download and view the complete annual report
Please find page 46 of the 2008 MetLife annual report below. You can navigate through the pages in the report by either clicking on the pages listed below, or by using the keyword search tool below to find specific information within the annual report.-
 1
1 -
2
-
3
-
4
-
5
-
6
-
7
-
8
-
9
-
10
-
11
-
12
-
13
-
14
-
15
-
16
-
17
-
18
-
19
-
20
-
21
-
22
-
23
-
24
-
25
-
26
-
27
-
28
-
29
-
30
-
31
-
32
-
33
-
34
-
35
-
 36
36 -
 37
37 -
 38
38 -
 39
39 -
 40
40 -
 41
41 -
 42
42 -
 43
43 -
 44
44 -
 45
45 -
 46
46 -
 47
47 -
 48
48 -
 49
49 -
 50
50 -
 51
51 -
 52
52 -
 53
53 -
 54
54 -
 55
55 -
 56
56 -
57
-
58
-
59
-
60
-
61
-
62
-
63
-
64
-
65
-
66
-
67
-
68
-
69
-
70
-
71
-
72
-
73
-
74
-
75
-
76
-
77
-
78
-
79
-
80
-
81
-
82
-
83
-
84
-
85
-
86
-
87
-
88
-
89
-
90
-
91
-
92
-
93
-
94
-
95
-
96
-
97
-
98
-
99
-
100
-
101
-
102
-
103
-
104
-
105
-
106
-
107
-
108
-
109
-
110
-
111
-
112
-
113
-
114
-
115
-
116
-
117
-
118
-
119
-
120
-
121
-
122
-
123
-
124
-
125
-
126
-
127
-
128
-
129
-
130
-
131
-
132
-
133
-
134
-
135
-
136
-
137
-
138
-
139
-
140
-
141
-
142
-
143
-
144
-
145
-
146
-
147
-
148
-
149
-
150
-
151
-
152
-
153
-
154
-
155
-
156
-
157
-
158
-
159
-
160
-
161
-
162
-
163
-
164
-
165
-
166
-
167
-
168
-
169
-
170
-
171
-
172
-
173
-
174
-
175
-
176
-
177
-
178
-
179
-
180
-
181
-
182
-
183
-
184
-
185
-
186
-
187
-
188
-
189
-
190
-
191
-
192
-
193
-
194
-
195
-
196
-
197
-
198
-
199
-
200
-
201
-
202
-
203
-
204
-
205
-
206
-
207
-
208
-
209
-
210
-
211
-
212
-
213
-
214
-
215
-
216
-
217
-
218
-
219
-
220
-
221
-
222
-
223
-
224
-
225
-
226
-
227
-
228
-
229
-
230
-
231
-
232
-
233
-
234
-
235
-
236
-
237
-
238
-
239
-
240
 |
 |
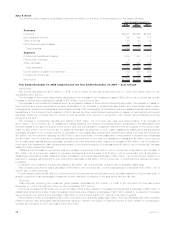
Expenses
Total expenses increased by $88 million, or 3%, to $2,728 million for the year ended December 31, 2008 from $2,640 million for the
comparable 2007 period.
Policyholder benefits and claims increased by $112 million due to an increase of $202 million in catastrophe losses primarily resulting
from severe thunderstorms and tornadoes in the Midwestern and Southern states in the second quarter of the current year and hurricanes
Ike, Gustav and Hanna in the third quarter of the current year, offset by $31 million of additional favorable development of prior years’
catastrophe losses and adjusting expenses, primarily from hurricane Katrina. Non-catastrophe policyholder benefits and claims decreased
$59 million resulting from $79 million of lower losses due to lower severities, primarily in the auto line of business, $11 million of additional
favorable development of prior year losses and a $12 million decrease in unallocated loss adjustment expenses primarily from lower
employee costs, offset by an increase of $34 million from higher non-catastrophe claim frequencies, primarily in the homeowners line of
business and a $9 million increase related to earned exposures.
Other expenses decreased by $25 million resulting mainly from a $21 million decrease in commissions, a $3 million decrease in surveys
and underwriting reports and a $5 million decrease in other sales related expenses, offset by a $13 million change in deferred acquisition
costs, all due to a decrease in policy activity, a decrease of $4 million related to a 2007 charge for structured settlements and a $5 million
decrease from other minor fluctuations in a number of expense categories. Policyholder dividends increased by $1 million.
Underwriting results, including catastrophes, in the Auto & Home segment were unfavorable for the year ended December 31, 2008
than as compared to the 2007 period, as the combined ratio, including catastrophes, increased to 91.2% from 88.4% for the year ended
December 31, 2007. Underwriting results, excluding catastrophes, in the Auto & Home segment were favorable for the year ended
December 31, 2008, as the combined ratio, excluding catastrophes, decreased to 83.1% from 86.3% for the year ended December 31,
2007.
Year Ended December 31, 2007 compared with the Year Ended December 31, 2006 — Auto & Home
Net Income
Net income increased by $20 million, or 5%, to $436 million for the year ended December 31, 2007 from $416 million for the
comparable 2006 period.
The increase in net income was primarily attributable to an increase in premiums of $28 million, net of income tax. The increase in
premiums was principally due to an increase of $38 million, net of income tax, related to increased exposures, an increase of $4 million, net
of income tax, from various voluntary and involuntary programs and an increase of $4 million, net of income tax, resulting from the change
in estimate on auto rate refunds due to a regulatory examination. Offsetting these increases was a $14 million, net of income tax, decrease
related to a reduction in average earned premium per policy and an increase in catastrophe reinsurance costs of $4 million, net of income
tax.
In addition, net investment income increased by $12 million, net of income tax, due primarily to a realignment of economic capital and
an increase in net investment income from higher yields, somewhat offset by a lower asset base. Net investment gains (losses) increased
by $8 million, net of income tax, for the year ended December 31, 2007 as compared to 2006.
In addition, other revenues increased by $14 million, net of income tax, due primarily to slower than anticipated claims payments in
2006 resulting in slower recognition of deferred income in 2006 related to a reinsurance contract as compared to 2007.
Negatively impacting net income were additional policyholder benefits and claims of $59 million, net of income tax, primarily due to
$39 million, $20 million, and $16 million, all net of income tax, of losses related to higher claim frequencies, higher earned exposures and
higher losses due to severity, respectively. In addition, a $13 million increase, net of income tax, in unallocated claims adjusting expenses
and an increase of $12 million, net of income tax, from a reduction in favorable development of 2006 losses negatively impacted net
income. Offsetting these increases was a $41 million, net of income tax, decrease in catastrophe losses, which included favorable
development of 2006 catastrophe liabilities of $10 million, net of income tax.
In addition, there was a decrease of $1 million, net of income tax, in policyholder dividends that positively impacted net income.
Also favorably impacting net income was a reduction of $11 million, net of income tax, in other expenses related to lower information
technology and advertising costs.
Revenues
Total revenues, excluding net investment gains (losses), increased by $82 million, or 3%, to $3,205 million for the year ended
December 31, 2007 from $3,123 million for the comparable 2006 period.
Premiums increased by $42 million due principally to a $59 million increase in premiums related to increased exposures, an increase of
$5 million from various voluntary and involuntary programs and an increase in premiums of $5 million, resulting from the change in estimate
on auto rate refunds due to a regulatory examination. Offsetting these increases was a $21 million decrease related to a reduction in
average earned premium per policy and an increase in catastrophe reinsurance costs of $6 million.
Net investment income increased by $19 million due to a realignment of economic capital and an increase in net investment income
from higher yields, somewhat offset by a lower asset base.
In addition, other revenues increased $21 million due primarily to slower than anticipated claims payments resulting in slower
recognition of deferred income in 2006 related to a reinsurance contract as compared to 2007.
Expenses
Total expenses increased by $72 million, or 3%, to $2,640 million for the year ended December 31, 2007 from $2,568 million for the
comparable 2006 period.
Policyholder benefits and claims increased by $90 million which was primarily due to an increase of $59 million from higher claim
frequencies, as a result of a return to normal weather patterns in 2007 compared to the milder weather in 2006 across the majority of the
country, and a $25 million and $30 million increase in losses related to higher severity and higher earned exposures, respectively. In
addition, an increase of $20 million in unallocated loss adjustment expenses, primarily resulting from an increase in claims-related
information technology costs, and a $19 million decrease in favorable development of 2006 losses, representing $148 million of favorable
development for 2007 as compared to $167 million for the 2006 period, increased policyholder benefits and claims. Offsetting these
43MetLife, Inc.