MetLife 2008 Annual Report Download - page 28
Download and view the complete annual report
Please find page 28 of the 2008 MetLife annual report below. You can navigate through the pages in the report by either clicking on the pages listed below, or by using the keyword search tool below to find specific information within the annual report.-
 1
1 -
2
-
3
-
4
-
5
-
6
-
7
-
8
-
9
-
10
-
11
-
12
-
13
-
14
-
15
-
16
-
17
-
 18
18 -
 19
19 -
 20
20 -
 21
21 -
 22
22 -
 23
23 -
 24
24 -
 25
25 -
 26
26 -
 27
27 -
 28
28 -
 29
29 -
 30
30 -
 31
31 -
 32
32 -
 33
33 -
 34
34 -
 35
35 -
 36
36 -
 37
37 -
 38
38 -
39
-
40
-
41
-
42
-
43
-
44
-
45
-
46
-
47
-
48
-
49
-
50
-
51
-
52
-
53
-
54
-
55
-
56
-
57
-
58
-
59
-
60
-
61
-
62
-
63
-
64
-
65
-
66
-
67
-
68
-
69
-
70
-
71
-
72
-
73
-
74
-
75
-
76
-
77
-
78
-
79
-
80
-
81
-
82
-
83
-
84
-
85
-
86
-
87
-
88
-
89
-
90
-
91
-
92
-
93
-
94
-
95
-
96
-
97
-
98
-
99
-
100
-
101
-
102
-
103
-
104
-
105
-
106
-
107
-
108
-
109
-
110
-
111
-
112
-
113
-
114
-
115
-
116
-
117
-
118
-
119
-
120
-
121
-
122
-
123
-
124
-
125
-
126
-
127
-
128
-
129
-
130
-
131
-
132
-
133
-
134
-
135
-
136
-
137
-
138
-
139
-
140
-
141
-
142
-
143
-
144
-
145
-
146
-
147
-
148
-
149
-
150
-
151
-
152
-
153
-
154
-
155
-
156
-
157
-
158
-
159
-
160
-
161
-
162
-
163
-
164
-
165
-
166
-
167
-
168
-
169
-
170
-
171
-
172
-
173
-
174
-
175
-
176
-
177
-
178
-
179
-
180
-
181
-
182
-
183
-
184
-
185
-
186
-
187
-
188
-
189
-
190
-
191
-
192
-
193
-
194
-
195
-
196
-
197
-
198
-
199
-
200
-
201
-
202
-
203
-
204
-
205
-
206
-
207
-
208
-
209
-
210
-
211
-
212
-
213
-
214
-
215
-
216
-
217
-
218
-
219
-
220
-
221
-
222
-
223
-
224
-
225
-
226
-
227
-
228
-
229
-
230
-
231
-
232
-
233
-
234
-
235
-
236
-
237
-
238
-
239
-
240
 |
 |

and initiatives, partially offset by the elimination of certain intercompany expenses previously charged to the International segment,
and a tax benefit associated with a 2006 income tax expense related to a revision of an estimate.
• India’s income from continuing operations decreased primarily due to headcount increases and growth initiatives, as well as the
impact of valuation allowances established against losses in both years.
• South Korea’s income from continuing operations decreased due to a favorable impact in 2006 associated with the implementation of
a more refined reserve valuation system, as well as additional expenses in 2007 associated with growth and infrastructure initiatives,
partially offset by continued growth and lower DAC amortization, both in the variable universal life business.
The Auto & Home segment’s income from continuing operations increased primarily due to an increase in premiums and other revenues,
an increase in net investment income, an increase in net investment gains and a decrease in other expenses. These were partially offset by
losses related to higher claim frequencies, higher earned exposures, higher losses due to severity, an increase in unallocated claims
adjusting expenses and an increase from a reduction in favorable development of 2006 losses, partially offset by a decrease in catastrophe
losses, which included favorable development of 2006 catastrophe liabilities, all of which are related to policyholder benefits and claims.
Corporate & Other’s income from continuing operations increased primarily due to higher net investment income, lower net investment
losses, lower corporate expenses, higher other revenues, integration costs incurred in 2006, and lower legal costs, partially offset by a
decrease in tax benefits, higher interest expense on debt, higher interest on uncertain tax positions, and higher interest credited to
bankholder deposits.
Revenues and Expenses
Premiums, Fees and Other Revenues
Premiums, fees and other revenues increased by $1,609 million, or 6%, to $29,673 million for the year ended December 31, 2007 from
$28,064 million for the comparable 2006 period.
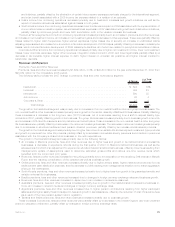
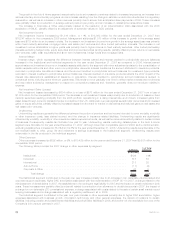
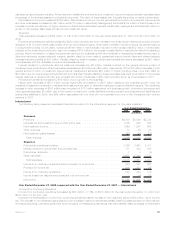
The following table provides the 2007 change in premiums, fees and other revenues by segment:
$ Change %ofTotal
$ Change
(In millions)
Institutional........................................................ $ 594 36%
Individual ......................................................... 365 23
International ....................................................... 560 35
Auto&Home ...................................................... 63 4
Corporate&Other ................................................... 27 2
Totalchange .................................................. $1,609 100%
The growth in the Institutional segment was primarily due to increases in the non-medical health & other and group life businesses. The
non-medical health & other business increased primarily due to growth in the dental, disability, AD&D and IDI businesses. Partially offsetting
these increases is a decrease in the long-term care (“LTC”) business, net of a decrease resulting from a shift to deposit liability-type
contracts in 2007, partially offset by growth in the business. The group life business increased primarily due to business growth in term life
and increases in COLI and life insurance sold to postretirement benefit plans. These increases in the non-medical health & other and group
life businesses were partially offset by a decrease in the retirement & savings business. The decrease in retirement & savings was primarily
due to a decrease in structured settlement and pension closeout premiums, partially offset by an increase across several products.
The growth in the Individual segment was primarily due to higher fee income from variable life and annuity and investment-type products
and growth in premiums from other life products, partially offset by a decrease in immediate annuity premiums and a decline in premiums
associated with the Company’s closed block business, in line with expectations.
ThegrowthintheInternationalsegmentwasprimarilyduetothefollowingfactors:
• An increase in Mexico’s premiums, fees and other revenues due to higher fees and growth in its institutional and universal life
businesses, a decrease in experience refunds during the first quarter of 2007 on Mexico’s institutional business, as well as the
adverse impact in 2006 of an adjustment for experience refunds on Mexico’s institutional business, offset by lower fees resulting from
management’s update of assumptions used to determine estimated gross profits and various one-time revenue items which
benefited both the current and prior years.
• Premiums, fees and other revenues increased in Hong Kong primarily due to the acquisition of the remaining 50% interest in MetLife
Fubon and the resulting consolidation of the operation as well as business growth.
• Chile’s premiums, fees and other revenues increased primarily due to higher annuity sales, higher institutional premiums from its
traditional and bank distribution channels, and the decrease in 2006 resulting from management’s decision not to match aggressive
pricing in the marketplace.
• South Korea’s premiums, fees and other revenues increased primarily due to higher fees from growth in its guaranteed annuity and
variable universal life businesses.
• Brazil’s premiums, fees and other revenues increased due to changes in foreign currency exchange rates and business growth.
• Premiums, fees and other revenues increased in Japan due to an increase in reinsurance assumed.
• Australia’s premiums, fees and other revenues increased primarily due to growth in the institutional and reinsurance business in-
force, an increase in retention levels and changes in foreign currency exchange rates.
• Argentina’s premiums, fees and other revenues increased due to higher pension contributions resulting from higher participant
salaries and a higher salary threshold subject to fees and growth in bancassurance, offset by the reduction of cost of insurance fees
as a result of the new pension system reform regulation.
• Taiwan’s and India’s premiums, fees and other revenues increased primarily due to business growth.
These increases in premiums, fees and other revenues were partially offset by a decrease in the United Kingdom due to an unearned
premium calculation refinement, partially offset by changes in foreign currency exchange rates.
25MetLife, Inc.