MetLife 2008 Annual Report Download - page 125
Download and view the complete annual report
Please find page 125 of the 2008 MetLife annual report below. You can navigate through the pages in the report by either clicking on the pages listed below, or by using the keyword search tool below to find specific information within the annual report.-
 1
1 -
2
-
3
-
4
-
5
-
6
-
7
-
8
-
9
-
10
-
11
-
12
-
13
-
14
-
15
-
16
-
17
-
18
-
19
-
20
-
21
-
22
-
23
-
24
-
25
-
26
-
27
-
28
-
29
-
30
-
31
-
32
-
33
-
34
-
35
-
36
-
37
-
38
-
39
-
40
-
41
-
42
-
43
-
44
-
45
-
46
-
47
-
48
-
49
-
50
-
51
-
52
-
53
-
54
-
55
-
56
-
57
-
58
-
59
-
60
-
61
-
62
-
63
-
64
-
65
-
66
-
67
-
68
-
69
-
70
-
71
-
72
-
73
-
74
-
75
-
76
-
77
-
78
-
79
-
80
-
81
-
82
-
83
-
84
-
85
-
86
-
87
-
88
-
89
-
90
-
91
-
92
-
93
-
94
-
95
-
96
-
97
-
98
-
99
-
100
-
101
-
102
-
103
-
104
-
105
-
106
-
107
-
108
-
109
-
110
-
111
-
112
-
113
-
114
-
 115
115 -
 116
116 -
 117
117 -
 118
118 -
 119
119 -
 120
120 -
 121
121 -
 122
122 -
 123
123 -
 124
124 -
 125
125 -
 126
126 -
 127
127 -
 128
128 -
 129
129 -
 130
130 -
 131
131 -
 132
132 -
 133
133 -
 134
134 -
 135
135 -
136
-
137
-
138
-
139
-
140
-
141
-
142
-
143
-
144
-
145
-
146
-
147
-
148
-
149
-
150
-
151
-
152
-
153
-
154
-
155
-
156
-
157
-
158
-
159
-
160
-
161
-
162
-
163
-
164
-
165
-
166
-
167
-
168
-
169
-
170
-
171
-
172
-
173
-
174
-
175
-
176
-
177
-
178
-
179
-
180
-
181
-
182
-
183
-
184
-
185
-
186
-
187
-
188
-
189
-
190
-
191
-
192
-
193
-
194
-
195
-
196
-
197
-
198
-
199
-
200
-
201
-
202
-
203
-
204
-
205
-
206
-
207
-
208
-
209
-
210
-
211
-
212
-
213
-
214
-
215
-
216
-
217
-
218
-
219
-
220
-
221
-
222
-
223
-
224
-
225
-
226
-
227
-
228
-
229
-
230
-
231
-
232
-
233
-
234
-
235
-
236
-
237
-
238
-
239
-
240
 |
 |

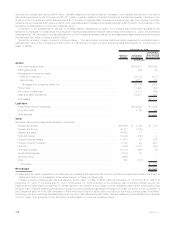
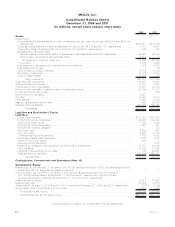
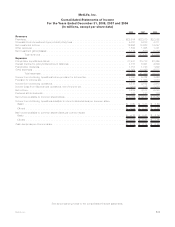
MetLife, Inc.
Consolidated Balance Sheets
December 31, 2008 and 2007
(In millions, except share and per share data)
2008 2007
Assets
Investments:
Fixed maturity securities available-for-sale, at estimated fair value (amortized cost: $209,508 and $229,354,
respectively) .............................................................. $188,251 $232,336
Equity securities available-for-sale, at estimated fair value (cost: $4,131 and $5,732, respectively) . . . . . . . . 3,197 5,911
Trading securities, at estimated fair value (cost: $1,107 and $768, respectively) . . . . . . . . . . . . . . . . . . . . 946 779
Mortgage and consumer loans:
Held-for-investment, at amortized cost (net of allowances for loan losses of $304 and $197, respectively) . . . . . . . . . . . 49,352 46,149
Held-for-sale,principallyatestimatedfairvalue........................................ 2,012 5
Mortgageandconsumerloans,net.............................................. 51,364 46,154
Policyloans................................................................ 9,802 9,326
Realestateandrealestatejointventuresheld-for-investment................................ 7,585 6,728
Realestateheld-for-sale........................................................ 1 39
Otherlimitedpartnershipinterests.................................................. 6,039 6,155
Short-terminvestments ........................................................ 13,878 2,544
Otherinvestedassets ......................................................... 17,248 8,076
Total investments . . . . . . . . . . . . . . . . . . . . . . . . . . . . . . . . . . . . . . . . . . . . . . . . . . . . . . . . 298,311 318,048
Cashandcashequivalents ....................................................... 24,207 9,961
Accruedinvestmentincome....................................................... 3,061 3,545
Premiumsandotherreceivables .................................................... 16,973 13,373
Deferredpolicyacquisitioncostsandvalueofbusinessacquired............................... 20,144 17,810
Currentincometaxrecoverable..................................................... — 334
Deferredincometaxassets ....................................................... 4,927 —
Goodwill ................................................................... 5,008 4,814
Otherassets................................................................. 7,262 8,239
Assetsofsubsidiariesheld-for-sale .................................................. 946 22,883
Separate account assets . . . . . . . . . . . . . . . . . . . . . . . . . . . . . . . . . . . . . . . . . . . . . . . . . . . . . . . . . 120,839 160,142
Totalassets............................................................ $501,678 $559,149
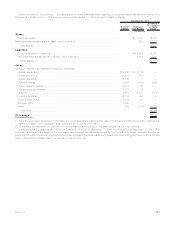
Liabilities and Stockholders’ Equity
Liabilities:
Futurepolicybenefits.......................................................... $130,555 $126,016
Policyholder account balances . . . . . . . . . . . . . . . . . . . . . . . . . . . . . . . . . . . . . . . . . . . . . . . . . . . . 149,805 130,342
Otherpolicyholderfunds........................................................ 7,762 7,838
Policyholderdividendspayable ................................................... 1,023 991
Policyholderdividendobligation................................................... — 789
Short-termdebt ............................................................. 2,659 667
Long-termdebt.............................................................. 9,667 9,100
Collateralfinancingarrangements.................................................. 5,192 4,882
Juniorsubordinateddebtsecurities................................................. 3,758 4,075
Currentincometaxpayable...................................................... 342 —
Deferredincometaxliability...................................................... — 1,502
Payablesforcollateralundersecuritiesloanedandothertransactions .......................... 31,059 44,136
Otherliabilities .............................................................. 14,535 12,829
Liabilitiesofsubsidiariesheld-for-sale ............................................... 748 20,661
Separate account liabilities . . . . . . . . . . . . . . . . . . . . . . . . . . . . . . . . . . . . . . . . . . . . . . . . . . . . . . 120,839 160,142
Total liabilities . . . . . . . . . . . . . . . . . . . . . . . . . . . . . . . . . . . . . . . . . . . . . . . . . . . . . . . . . . 477,944 523,970
Contingencies, Commitments and Guarantees (Note 16)
Stockholders’ Equity:
Preferred stock, par value $0.01 per share; 200,000,000 shares authorized; 84,000,000 shares issued and
outstanding;$2,100aggregateliquidationpreference..................................... 1 1
Common stock, par value $0.01 per share; 3,000,000,000 shares authorized; 798,016,664 and
786,766,664 shares issued at December 31, 2008 and 2007, respectively; 793,629,070 and
729,223,440 shares outstanding at December 31, 2008 and 2007, respectively . . . . . . . . . . . . . . . . . . . 8 8
Additionalpaid-incapital......................................................... 15,811 17,098
Retainedearnings ............................................................. 22,403 19,884
Treasury stock, at cost; 4,387,594 and 57,543,224 shares at December 31, 2008 and 2007, respectively . . . . (236) (2,890)
Accumulatedothercomprehensiveincome(loss) ......................................... (14,253) 1,078
Totalstockholders’equity...................................................... 23,734 35,179
Totalliabilitiesandstockholders’equity............................................. $501,678 $559,149
See accompanying notes to the consolidated financial statements.
F-2 MetLife, Inc.