MetLife 2008 Annual Report Download - page 6
Download and view the complete annual report
Please find page 6 of the 2008 MetLife annual report below. You can navigate through the pages in the report by either clicking on the pages listed below, or by using the keyword search tool below to find specific information within the annual report.-
 1
1 -
 2
2 -
 3
3 -
 4
4 -
 5
5 -
 6
6 -
 7
7 -
 8
8 -
 9
9 -
 10
10 -
 11
11 -
 12
12 -
 13
13 -
 14
14 -
 15
15 -
 16
16 -
 17
17 -
18
-
19
-
20
-
21
-
22
-
23
-
24
-
25
-
26
-
27
-
28
-
29
-
30
-
31
-
32
-
33
-
34
-
35
-
36
-
37
-
38
-
39
-
40
-
41
-
42
-
43
-
44
-
45
-
46
-
47
-
48
-
49
-
50
-
51
-
52
-
53
-
54
-
55
-
56
-
57
-
58
-
59
-
60
-
61
-
62
-
63
-
64
-
65
-
66
-
67
-
68
-
69
-
70
-
71
-
72
-
73
-
74
-
75
-
76
-
77
-
78
-
79
-
80
-
81
-
82
-
83
-
84
-
85
-
86
-
87
-
88
-
89
-
90
-
91
-
92
-
93
-
94
-
95
-
96
-
97
-
98
-
99
-
100
-
101
-
102
-
103
-
104
-
105
-
106
-
107
-
108
-
109
-
110
-
111
-
112
-
113
-
114
-
115
-
116
-
117
-
118
-
119
-
120
-
121
-
122
-
123
-
124
-
125
-
126
-
127
-
128
-
129
-
130
-
131
-
132
-
133
-
134
-
135
-
136
-
137
-
138
-
139
-
140
-
141
-
142
-
143
-
144
-
145
-
146
-
147
-
148
-
149
-
150
-
151
-
152
-
153
-
154
-
155
-
156
-
157
-
158
-
159
-
160
-
161
-
162
-
163
-
164
-
165
-
166
-
167
-
168
-
169
-
170
-
171
-
172
-
173
-
174
-
175
-
176
-
177
-
178
-
179
-
180
-
181
-
182
-
183
-
184
-
185
-
186
-
187
-
188
-
189
-
190
-
191
-
192
-
193
-
194
-
195
-
196
-
197
-
198
-
199
-
200
-
201
-
202
-
203
-
204
-
205
-
206
-
207
-
208
-
209
-
210
-
211
-
212
-
213
-
214
-
215
-
216
-
217
-
218
-
219
-
220
-
221
-
222
-
223
-
224
-
225
-
226
-
227
-
228
-
229
-
230
-
231
-
232
-
233
-
234
-
235
-
236
-
237
-
238
-
239
-
240
 |
 |

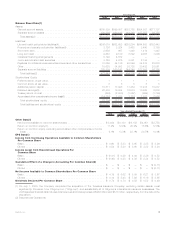
2008 2007 2006 2005 2004
December 31,
(In millions)
Balance Sheet Data(1)
Assets:
Generalaccountassets.................................. $380,839 $399,007 $383,758 $354,857 $271,137
Separate account assets . . . . . . . . . . . . . . . . . . . . . . . . . . . . . . . . . 120,839 160,142 144,349 127,855 86,755
Totalassets(2) ...................................... $501,678 $559,149 $528,107 $482,712 $357,892
Liabilities:
Life and health policyholder liabilities(4) . . . . . . . . . . . . . . . . . . . . . . . . $286,019 $262,652 $253,284 $244,683 $182,443
Property and casualty policyholder liabilities(4) . . . . . . . . . . . . . . . . . . . 3,126 3,324 3,453 3,490 3,180
Short-termdebt....................................... 2,659 667 1,449 1,414 1,445
Long-termdebt ....................................... 9,667 9,100 8,822 9,088 7,006
Collateralfinancingarrangements ........................... 5,192 4,882 — — —
Junior subordinated debt securities . . . . . . . . . . . . . . . . . . . . . . . . . . 3,758 4,075 3,381 2,134 —
Payables for collateral under securities loaned and other transactions . . . . 31,059 44,136 45,846 34,515 28,678
Other.............................................. 15,625 34,992 33,725 30,432 25,561
Separate account liabilities . . . . . . . . . . . . . . . . . . . . . . . . . . . . . . . . 120,839 160,142 144,349 127,855 86,755
Total liabilities(2) . . . . . . . . . . . . . . . . . . . . . . . . . . . . . . . . . . . . . 477,944 523,970 494,309 453,611 335,068
Stockholders’ Equity
Preferredstock,atparvalue............................... 1 1 1 1 —
Commonstock,atparvalue............................... 8 8 8 8 8
Additional paid-in capital . . . . . . . . . . . . . . . . . . . . . . . . . . . . . . . . . 15,811 17,098 17,454 17,274 15,037
Retainedearnings(5).................................... 22,403 19,884 16,574 10,865 6,608
Treasurystock,atcost .................................. (236) (2,890) (1,357) (959) (1,785)
Accumulated other comprehensive income (loss)(6) . . . . . . . . . . . . . . . . . . . . (14,253) 1,078 1,118 1,912 2,956
Totalstockholders’equity ............................... 23,734 35,179 33,798 29,101 22,824
Total liabilities and stockholders’ equity . . . . . . . . . . . . . . . . . . . . . . $501,678 $559,149 $528,107 $482,712 $357,892
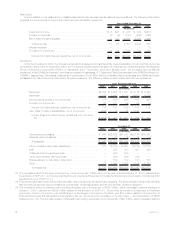
2008 2007 2006 2005 2004
(In millions, except per share data)
Years Ended December 31,
Other Data(1)
Netincomeavailabletocommonshareholders....................... $3,084 $4,180 $6,159 $4,651 $2,758
Returnoncommonequity(7)................................... 11.2% 12.9% 20.9% 18.6% 12.5%
Return on common equity, excluding accumulated other comprehensive income
(loss) ................................................ 9.1% 13.3% 22.1% 20.7% 14.4%
EPS Data(1)
Income from Continuing Operations Available to Common Shareholders
Per Common Share
Basic.................................................. $ 4.60 $ 5.33 $ 3.65 $ 3.85 $ 3.26
Diluted................................................. $ 4.54 $ 5.20 $ 3.60 $ 3.82 $ 3.24
Income (Loss) from Discontinued Operations Per
Common Share
Basic.................................................. $ (0.41) $ 0.29 $ 4.44 $ 2.36 $ 0.52
Diluted................................................. $ (0.40) $ 0.28 $ 4.39 $ 2.34 $ 0.52
Cumulative Effect of a Change in Accounting Per Common Share(3)
Basic.................................................. $ — $ — $ — $ — $ (0.11)
Diluted................................................. $ — $ — $ — $ — $ (0.11)
Net Income Available to Common Shareholders Per Common Share
Basic.................................................. $ 4.19 $ 5.62 $ 8.09 $ 6.21 $ 3.67
Diluted................................................. $ 4.14 $ 5.48 $ 7.99 $ 6.16 $ 3.65
Dividends Declared Per Common Share .......................... $ 0.74 $ 0.74 $ 0.59 $ 0.52 $ 0.46
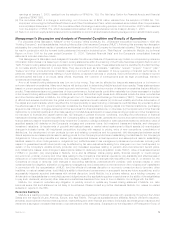
(1) On July 1, 2005, the Company completed the acquisition of The Travelers Insurance Company, excluding certain assets, most
significantly, Primerica, from Citigroup Inc. (“Citigroup”), and substantially all of Citigroup’s international insurance businesses. The
2005 selected financial data includes total revenues and total expenses of $966 million and $577 million, respectively, from the date of the
acquisition.
(2) Discontinued Operations:
3MetLife, Inc.