MetLife 2008 Annual Report Download - page 47
Download and view the complete annual report
Please find page 47 of the 2008 MetLife annual report below. You can navigate through the pages in the report by either clicking on the pages listed below, or by using the keyword search tool below to find specific information within the annual report.-
 1
1 -
2
-
3
-
4
-
5
-
6
-
7
-
8
-
9
-
10
-
11
-
12
-
13
-
14
-
15
-
16
-
17
-
18
-
19
-
20
-
21
-
22
-
23
-
24
-
25
-
26
-
27
-
28
-
29
-
30
-
31
-
32
-
33
-
34
-
35
-
36
-
 37
37 -
 38
38 -
 39
39 -
 40
40 -
 41
41 -
 42
42 -
 43
43 -
 44
44 -
 45
45 -
 46
46 -
 47
47 -
 48
48 -
 49
49 -
 50
50 -
 51
51 -
 52
52 -
 53
53 -
 54
54 -
 55
55 -
 56
56 -
 57
57 -
58
-
59
-
60
-
61
-
62
-
63
-
64
-
65
-
66
-
67
-
68
-
69
-
70
-
71
-
72
-
73
-
74
-
75
-
76
-
77
-
78
-
79
-
80
-
81
-
82
-
83
-
84
-
85
-
86
-
87
-
88
-
89
-
90
-
91
-
92
-
93
-
94
-
95
-
96
-
97
-
98
-
99
-
100
-
101
-
102
-
103
-
104
-
105
-
106
-
107
-
108
-
109
-
110
-
111
-
112
-
113
-
114
-
115
-
116
-
117
-
118
-
119
-
120
-
121
-
122
-
123
-
124
-
125
-
126
-
127
-
128
-
129
-
130
-
131
-
132
-
133
-
134
-
135
-
136
-
137
-
138
-
139
-
140
-
141
-
142
-
143
-
144
-
145
-
146
-
147
-
148
-
149
-
150
-
151
-
152
-
153
-
154
-
155
-
156
-
157
-
158
-
159
-
160
-
161
-
162
-
163
-
164
-
165
-
166
-
167
-
168
-
169
-
170
-
171
-
172
-
173
-
174
-
175
-
176
-
177
-
178
-
179
-
180
-
181
-
182
-
183
-
184
-
185
-
186
-
187
-
188
-
189
-
190
-
191
-
192
-
193
-
194
-
195
-
196
-
197
-
198
-
199
-
200
-
201
-
202
-
203
-
204
-
205
-
206
-
207
-
208
-
209
-
210
-
211
-
212
-
213
-
214
-
215
-
216
-
217
-
218
-
219
-
220
-
221
-
222
-
223
-
224
-
225
-
226
-
227
-
228
-
229
-
230
-
231
-
232
-
233
-
234
-
235
-
236
-
237
-
238
-
239
-
240
 |
 |

increases in losses was a decrease of $63 million in catastrophe losses, which includes $15 million of favorable loss development from
2006 catastrophes.
Policyholder dividends decreased by $1 million in 2007 as compared to 2006.
Other expenses decreased by $17 million primarily related to lower information technology and advertising costs, partially offset by
minor changes in a variety of expense categories.
Underwriting results, excluding catastrophes, in the Auto & Home segment were favorable for the year ended December 31, 2007,
although lower than the comparable period of 2006, as the combined ratio, excluding catastrophes, increased to 86.3% from 82.8% for the
year ended December 31, 2006.
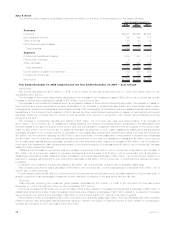
Corporate & Other
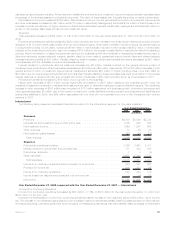
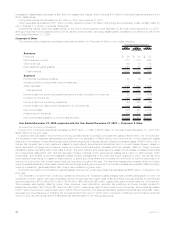
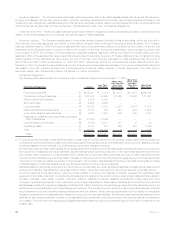
The following table presents consolidated financial information for Corporate & Other for the years indicated:
2008 2007 2006
Years Ended December 31,
(In millions)
Revenues
Premiums..................................................... $ 28 $ 35 $ 37
Netinvestmentincome............................................. 817 1,419 998
Otherrevenues ................................................. 184 72 43
Netinvestmentgains(losses) ........................................ 947 45 (154)
Totalrevenues................................................. 1,976 1,571 924
Expenses
Policyholderbenefitsandclaims ...................................... 48 46 38
Interestcreditedtopolicyholderaccountbalances........................... 7 — —
Otherexpenses ................................................. 1,898 1,409 1,362
Totalexpenses ................................................ 1,953 1,455 1,400
Income (loss) from continuing operations before provision (benefit) for income tax . . . . . . 23 116 (476)
Provisionforincometax............................................ (143) (129) (437)
Income(loss)fromcontinuingoperations................................. 166 245 (39)
Income(loss)fromdiscontinuedoperations,netofincometax ................... (293) 195 3,285
Netincome(loss) ................................................ (127) 440 3,246
Preferredstockdividends........................................... 125 137 134
Netincome(loss)availabletocommonshareholders ......................... $ (252) $ 303 $3,112
Year Ended December 31, 2008 compared with the Year Ended December 31, 2007 — Corporate & Other
Income from Continuing Operations
Income from continuing operations decreased by $79 million, or 32%, to $166 million for the year ended December 31, 2008 from
$245 million for the prior year.
Included in this decrease in income from continuing operations is an increase in net investment gains of $586 million, net of income tax.
The increase in net investment gains arises principally from the elimination of $993 million, net of income tax, of net investment losses
arising from the transfer of fixed maturity securities between segments. This was partially offset by increased losses of $263 million, net of
income tax, primarily due to net investment losses on fixed maturity securities and derivatives, and, to a much lesser degree, losses on
equity securities, mortgage and consumer loans, and other limited partnership interests which are partially offset by foreign currency
transaction gains originating within Corporate & Other. The fixed maturity and equity security losses include losses on sales of securities
and impairments associated with financial services industry holdings which experienced losses as a result of bankruptcies, FDIC
receivership, and federal government assisted capital infusion transactions in the third and fourth quarters of 2008, as well as other
credit related impairments or losses on fixed maturity or equity securities where the Company did not intend to hold the securities until
recovery in conjunction with overall market declines occurring throughout the year. The derivative losses were primarily driven by foreign
currency swaps caused by unfavorable interest rate and foreign exchange movements. The derivative losses were partially offset by foreign
currency transaction gains associated with foreign denominated long-term debt.
Excluding the impact of net investment gains (losses), income from continuing operations decreased by $665 million, compared to the
prior year.
The decrease in income from continuing operations excluding net investment gains (losses) was primarily attributable to lower net
investment income, higher corporate expenses, higher interest expense, higher legal costs and higher interest credited to policyholder
account balances of $391 million $216 million, $104 million, $46 million and $5 million, respectively, each of which were net of income tax.
This decrease was partially offset by higher other revenues, lower interest on uncertain tax positions, and lower interest credited to
bankholder deposits of $73 million, $27 million and $21 million, respectively, each of which were net of income tax. Tax benefits decreased
by $17 million over the prior year primarily due to a $16 million recognition of a deferred tax liability related to the RGA split-off and $1 million
decrease from the difference of finalizing the Company’s 2007 tax return in 2008 when compared to finalizing the Company’s 2006 tax
return in 2007 and the actual and the estimated tax rate allocated to the various segments.
44 MetLife, Inc.