MetLife 2008 Annual Report Download - page 98
Download and view the complete annual report
Please find page 98 of the 2008 MetLife annual report below. You can navigate through the pages in the report by either clicking on the pages listed below, or by using the keyword search tool below to find specific information within the annual report.-
 1
1 -
2
-
3
-
4
-
5
-
6
-
7
-
8
-
9
-
10
-
11
-
12
-
13
-
14
-
15
-
16
-
17
-
18
-
19
-
20
-
21
-
22
-
23
-
24
-
25
-
26
-
27
-
28
-
29
-
30
-
31
-
32
-
33
-
34
-
35
-
36
-
37
-
38
-
39
-
40
-
41
-
42
-
43
-
44
-
45
-
46
-
47
-
48
-
49
-
50
-
51
-
52
-
53
-
54
-
55
-
56
-
57
-
58
-
59
-
60
-
61
-
62
-
63
-
64
-
65
-
66
-
67
-
68
-
69
-
70
-
71
-
72
-
73
-
74
-
75
-
76
-
77
-
78
-
79
-
80
-
81
-
82
-
83
-
84
-
85
-
86
-
87
-
 88
88 -
 89
89 -
 90
90 -
 91
91 -
 92
92 -
 93
93 -
 94
94 -
 95
95 -
 96
96 -
 97
97 -
 98
98 -
 99
99 -
 100
100 -
 101
101 -
 102
102 -
 103
103 -
 104
104 -
 105
105 -
 106
106 -
 107
107 -
 108
108 -
109
-
110
-
111
-
112
-
113
-
114
-
115
-
116
-
117
-
118
-
119
-
120
-
121
-
122
-
123
-
124
-
125
-
126
-
127
-
128
-
129
-
130
-
131
-
132
-
133
-
134
-
135
-
136
-
137
-
138
-
139
-
140
-
141
-
142
-
143
-
144
-
145
-
146
-
147
-
148
-
149
-
150
-
151
-
152
-
153
-
154
-
155
-
156
-
157
-
158
-
159
-
160
-
161
-
162
-
163
-
164
-
165
-
166
-
167
-
168
-
169
-
170
-
171
-
172
-
173
-
174
-
175
-
176
-
177
-
178
-
179
-
180
-
181
-
182
-
183
-
184
-
185
-
186
-
187
-
188
-
189
-
190
-
191
-
192
-
193
-
194
-
195
-
196
-
197
-
198
-
199
-
200
-
201
-
202
-
203
-
204
-
205
-
206
-
207
-
208
-
209
-
210
-
211
-
212
-
213
-
214
-
215
-
216
-
217
-
218
-
219
-
220
-
221
-
222
-
223
-
224
-
225
-
226
-
227
-
228
-
229
-
230
-
231
-
232
-
233
-
234
-
235
-
236
-
237
-
238
-
239
-
240
 |
 |

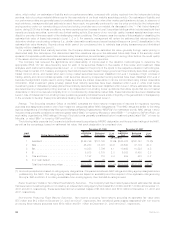
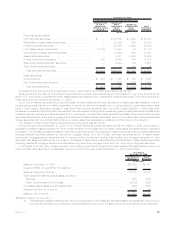
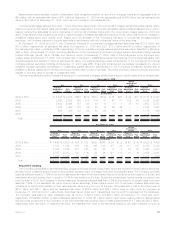
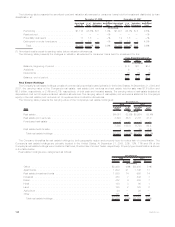
Corporate Fixed Maturity Securities. The table below shows the major industry types that comprise the corporate fixed maturity
holdings at:
Estimated
Fair Value %of
Total Estimated
Fair Value %of
Total
2008 2007
(In millions)
December 31,
Foreign(1)............................................. $29,679 32.0% $ 37,166 33.4%
Finance .............................................. 14,996 16.1 20,639 18.6
Industrial.............................................. 13,324 14.3 15,838 14.3
Consumer............................................. 13,122 14.1 15,793 14.2
Utility................................................ 12,434 13.4 13,206 11.9
Communications......................................... 5,714 6.1 7,679 6.9
Other................................................ 3,713 4.0 764 0.7
Total . . . . . . . . . . . . . . . . . . . . . . . . . . . . . . . . . . . . . . . . . . . . . . . $92,982 100.0% $111,085 100.0%
(1) Includes U.S. dollar-denominated debt obligations of foreign obligors, and other fixed maturity foreign investments.
The Company maintains a diversified corporate fixed maturity portfolio across industries and issuers. The portfolio does not have
exposure to any single issuer in excess of 1% of the total invested assets of the portfolio. At December 31, 2008 and 2007, the Company’s
combined holdings in the ten issuers to which it had the greatest exposure totaled $8.4 billion and $7.8 billion, respectively, the total of
these ten issuers being less than 3% of the Company’s total invested assets at such dates. The exposure to the largest single issuer of
corporate fixed maturity securities held at December 31, 2008 and 2007 was $1.5 billion and $1.2 billion, respectively.
The Company has hedged all of its material exposure to foreign currency risk in its corporate fixed maturity portfolio. In the Company’s
international insurance operations, both its assets and liabilities are generally denominated in local currencies.
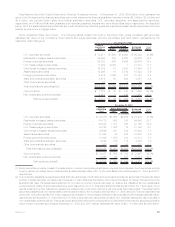
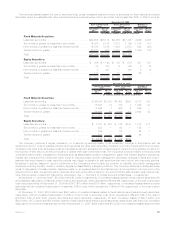
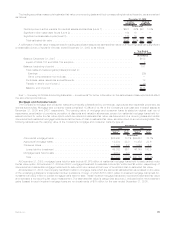
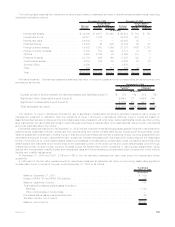
Structured Securities. The following table shows the types of structured securities the Company held at:
Estimated
Fair Value %of
Total Estimated
Fair Value %of
Total
2008 2007
(In millions)
December 31,
Residential mortgage-backed securities:
Collateralizedmortgageobligations ............................. $26,025 44.0% $36,303 44.0%
Pass-throughsecurities..................................... 10,003 16.8 18,692 22.6
Totalresidentialmortgage-backedsecurities ....................... 36,028 60.8 54,995 66.6
Commercialmortgage-backedsecurities.......................... 12,644 21.4 16,993 20.6
Asset-backedsecurities .................................... 10,523 17.8 10,572 12.8
Total . . . . . . . . . . . . . . . . . . . . . . . . . . . . . . . . . . . . . . . . . . . . . . . . $59,195 100.0% $82,560 100.0%
Collateralized mortgage obligations are a type of mortgage-backed security that creates separate pools or tranches of pass-through
cash flows for different classes of bondholders with varying maturities. Pass-through mortgage-backed securities are a type of asset-
backed security that is secured by a mortgage or collection of mortgages. The monthly mortgage payments from homeowners pass from
the originating bank through an intermediary, such as a government agency or investment bank, which collects the payments, and for fee,
remits or passes these payments through to the holders of the pass-through securities.
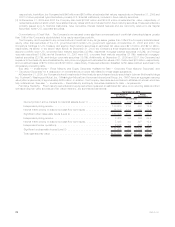
Residential Mortgage-Backed Securities. At December 31, 2008, the exposures in the Company’s residential mortgage-backed
securities portfolio consist of agency, prime, and alternative residential mortgage loans (“Alt-A”) securities of 68%, 23%, and 9% of the total
holdings, respectively. At December 31, 2008 and 2007, $33.3 billion and $54.7 billion, respectively, or 92% and 99% respectively, of the
residential mortgage-backed securities were rated Aaa/AAA by Moody’s, S&P or Fitch. The majority of the agency residential mortgage-
backed securities are guaranteed or otherwise supported by the Federal National Mortgage Association, the Federal Home Loan Mortgage
Corporation or the Government National Mortgage Association. Prime residential mortgage lending includes the origination of residential
mortgage loans to the most credit-worthy customers with high quality credit profiles. Alt-A residential mortgage loans are a classification of
mortgage loans where the risk profile of the borrower falls between prime and sub-prime. At December 31, 2008 and 2007, the Company’s
Alt-A residential mortgage-backed securities exposure was $3.4 billion and $6.3 billion, respectively, with an unrealized loss of $1,963 mil-
lion and $139 million, respectively. At December 31, 2008 and December 31, 2007, $2.1 billion and $6.3 billion, respectively, or 63% and
99%, respectively, of the Company’s Alt-A residential mortgage-backed securities were rated Aa/AA or better by Moody’s, S&P or Fitch; At
December 31, 2008 the Company’s Alt-A holdings are distributed as follows: 23% 2007 vintage year, 25% 2006 vintage year; and 52% in
the 2005 and prior vintage years. Vintage year refers to the year of origination and not to the year of purchase. In December 2008, certain
Alt-A residential mortgage-backed securities experienced ratings downgrades from investment grade to below investment grade, con-
tributing to the decrease year over year cited above in those securities rated Aa/AA or better. In January 2009 Moody’s revised its loss
projections for Alt-A residential mortgage-backed securities, and the Company anticipates that Moody’s will be downgrading virtually all
2006 and 2007 vintage year Alt-A securities to below investment grade, which will increase the percentage of our Alt-A residential
mortgage-backed securities portfolio that will be rated below investment grade. Our analysis suggests that Moody’s is applying essentially
95MetLife, Inc.