MetLife 2008 Annual Report Download - page 40
Download and view the complete annual report
Please find page 40 of the 2008 MetLife annual report below. You can navigate through the pages in the report by either clicking on the pages listed below, or by using the keyword search tool below to find specific information within the annual report.-
 1
1 -
2
-
3
-
4
-
5
-
6
-
7
-
8
-
9
-
10
-
11
-
12
-
13
-
14
-
15
-
16
-
17
-
18
-
19
-
20
-
21
-
22
-
23
-
24
-
25
-
26
-
27
-
28
-
29
-
 30
30 -
 31
31 -
 32
32 -
 33
33 -
 34
34 -
 35
35 -
 36
36 -
 37
37 -
 38
38 -
 39
39 -
 40
40 -
 41
41 -
 42
42 -
 43
43 -
 44
44 -
 45
45 -
 46
46 -
 47
47 -
 48
48 -
 49
49 -
 50
50 -
51
-
52
-
53
-
54
-
55
-
56
-
57
-
58
-
59
-
60
-
61
-
62
-
63
-
64
-
65
-
66
-
67
-
68
-
69
-
70
-
71
-
72
-
73
-
74
-
75
-
76
-
77
-
78
-
79
-
80
-
81
-
82
-
83
-
84
-
85
-
86
-
87
-
88
-
89
-
90
-
91
-
92
-
93
-
94
-
95
-
96
-
97
-
98
-
99
-
100
-
101
-
102
-
103
-
104
-
105
-
106
-
107
-
108
-
109
-
110
-
111
-
112
-
113
-
114
-
115
-
116
-
117
-
118
-
119
-
120
-
121
-
122
-
123
-
124
-
125
-
126
-
127
-
128
-
129
-
130
-
131
-
132
-
133
-
134
-
135
-
136
-
137
-
138
-
139
-
140
-
141
-
142
-
143
-
144
-
145
-
146
-
147
-
148
-
149
-
150
-
151
-
152
-
153
-
154
-
155
-
156
-
157
-
158
-
159
-
160
-
161
-
162
-
163
-
164
-
165
-
166
-
167
-
168
-
169
-
170
-
171
-
172
-
173
-
174
-
175
-
176
-
177
-
178
-
179
-
180
-
181
-
182
-
183
-
184
-
185
-
186
-
187
-
188
-
189
-
190
-
191
-
192
-
193
-
194
-
195
-
196
-
197
-
198
-
199
-
200
-
201
-
202
-
203
-
204
-
205
-
206
-
207
-
208
-
209
-
210
-
211
-
212
-
213
-
214
-
215
-
216
-
217
-
218
-
219
-
220
-
221
-
222
-
223
-
224
-
225
-
226
-
227
-
228
-
229
-
230
-
231
-
232
-
233
-
234
-
235
-
236
-
237
-
238
-
239
-
240
 |
 |
• South Korea by $3 million, net of income tax, primarily due to higher revenues from business growth and higher investment yields, a
reduction in claim liabilities from a refinement in methodology, as well as a refinement in DAC capitalization, partially offset by higher
claims and operating expenses, including an increase in DAC amortization related to market performance.
• Australia by $3 million, net of income tax, primarily due to business growth slightly offset by an increase in claim liabilities based on a
review of experience.
• The United Kingdom by $2 million, net of income tax, primarily due to business growth.
Contributions from the other countries account for the remainder of the change in income from continuing operations.
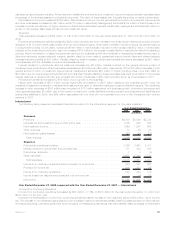
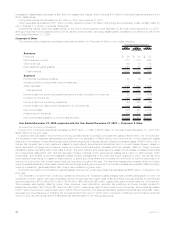
Revenues
Total revenues, excluding net investment gains (losses), increased by $470 million, or 9%, to $5,832 million for the year ended
December 31, 2008 from $5,362 million for the prior year. Excluding the adverse impact of changes in foreign currency exchange rates of
$135 million, total revenues increased by $605 million, or 12%, from the prior year.
Premiums, fees and other revenues increased by $468 million, or 11%, to $4,583 million for the year ended December 31, 2008 from
$4,115 million for the prior year. Excluding the adverse impact of changes in foreign currency exchange rates of $109 million, premiums,
fees and other revenues increased by $577 million, or 14%, from the prior year.
Premiums, fees and other revenues increased in:
• Chile by $150 million primarily due to higher annuity sales as well as higher institutional premiums from its traditional and bank
distribution channels.
• Mexico by $120 million due to growth in its individual and institutional businesses as well as the reinstatement of $8 million of
premiums from prior years partially offset by a decrease of $13 million in experience refunds in the prior year on Mexico’s institutional
business and a decrease in fees due to management’s update of assumptions used to determine estimated gross profits in both the
current and prior years.
• Hong Kong by $77 million primarily due to the acquisition of the remaining 50% interest in MetLife Fubon in the second quarter of
2007 and the resulting consolidation of the operation beginning in the third quarter of 2007 slightly offset by lower business growth.
• The United Kingdom by $68 million primarily due to growth in the reinsurance business as well as the prior year impact of an unearned
premium calculation refinement.
• South Korea by $68 million due to growth in its guaranteed annuity and variable universal life businesses as well as in its traditional
business.
• Australia by $54 million as a result of growth in the institutional business and an increase in retention levels.
• India, Brazil, Belgium, and Taiwan by $34 million, $28 million, $12 million and $3 million, respectively, due to business growth.
• The Company’s Japan operations by $17 million due to an increase in fees from assumed reinsurance.
Partially offsetting these increases, premiums, fees and other revenues decreased in Argentina by $60 million primarily due to a
decrease in premiums in the pension business, for which pension reform eliminated the obligation of plan administrators to provide death
and disability coverage effective January 1, 2008. The decrease related to the pension business was partially offset by growth in its
institutional and bancassurance businesses.
Contributions from the other countries account for the remainder of the change in premiums, fees and other revenues.
Net investment income is relatively flat with an increase of $2 million to $1,249 million for the year ended December 31, 2008 from
$1,247 million for the prior year. Excluding the adverse impact of changes in foreign currency exchange rates of $26 million, net investment
income increased by $28 million, or 2% from the prior year.
Net investment income increased in:
• Chile by $93 million due to the impact of higher inflation rates on indexed securities, the valuations and returns of which are linked to
inflation rates, an increase in invested assets, as well as higher joint venture income.
• Mexico by $75 million due to an increase in invested assets, the impact of higher inflation rates on indexed securities, higher short-
term yields as well as the lengthening of the duration of the portfolio.
• Japan by $20 million due to an increase of $166 million from hedging activities associated with Japan’s guaranteed annuity business
partially offset by a decrease of $146 million, net of income tax, in the Company’s earnings from its investment in Japan due to an
increase in losses on embedded derivatives associated with variable annuity riders and the impact of a refinement in assumptions for
the guaranteed annuity business partially offset by the favorable impact from the utilization of the fair value option for certain fixed
annuities.
• South Korea and Taiwan by $19 million and $9 million, respectively, due to increases in invested assets as well as higher portfolio
yields.
• Argentina by $6 million primarily due to the impact of higher inflation rates on indexed securities partially offset by higher losses on the
trading securities portfolio.
• India by $5 million primarily due to increases in invested assets.
Partially offsetting these increases, net investment income decreased in:
• Hong Kong by $160 million despite the acquisition of the remaining 50% interest in MetLife Fubon in the second quarter of 2007 and
the resulting consolidation of the operation beginning in the third quarter of 2007, because of the negative investment income for the
year due to the losses on the trading securities portfolio which supports unit-linked policyholder liabilities.
• The home office of $24 million primarily due to an increase in the amount charged for economic capital.
• Ireland by $21 million primarily due to losses in the current year on the trading securities portfolio which supports unit-linked
policyholder liabilities, partially offset by an increase due to higher invested assets resulting from capital contributions in the prior
year.
Contributions from the other countries account for the remainder of the change in net investment income.
Expenses
Total expenses increased by $448 million, or 10%, to $5,015 million for the year ended December 31, 2008 from $4,567 million for the
prior year. Excluding the negative impact of changes in foreign currency exchange rates of $120 million, total expenses increased by
$568 million, or 13%, from the prior year.
37MetLife, Inc.