MetLife 2008 Annual Report Download - page 160
Download and view the complete annual report
Please find page 160 of the 2008 MetLife annual report below. You can navigate through the pages in the report by either clicking on the pages listed below, or by using the keyword search tool below to find specific information within the annual report.-
 1
1 -
2
-
3
-
4
-
5
-
6
-
7
-
8
-
9
-
10
-
11
-
12
-
13
-
14
-
15
-
16
-
17
-
18
-
19
-
20
-
21
-
22
-
23
-
24
-
25
-
26
-
27
-
28
-
29
-
30
-
31
-
32
-
33
-
34
-
35
-
36
-
37
-
38
-
39
-
40
-
41
-
42
-
43
-
44
-
45
-
46
-
47
-
48
-
49
-
50
-
51
-
52
-
53
-
54
-
55
-
56
-
57
-
58
-
59
-
60
-
61
-
62
-
63
-
64
-
65
-
66
-
67
-
68
-
69
-
70
-
71
-
72
-
73
-
74
-
75
-
76
-
77
-
78
-
79
-
80
-
81
-
82
-
83
-
84
-
85
-
86
-
87
-
88
-
89
-
90
-
91
-
92
-
93
-
94
-
95
-
96
-
97
-
98
-
99
-
100
-
101
-
102
-
103
-
104
-
105
-
106
-
107
-
108
-
109
-
110
-
111
-
112
-
113
-
114
-
115
-
116
-
117
-
118
-
119
-
120
-
121
-
122
-
123
-
124
-
125
-
126
-
127
-
128
-
129
-
130
-
131
-
132
-
133
-
134
-
135
-
136
-
137
-
138
-
139
-
140
-
141
-
142
-
143
-
144
-
145
-
146
-
147
-
148
-
149
-
 150
150 -
 151
151 -
 152
152 -
 153
153 -
 154
154 -
 155
155 -
 156
156 -
 157
157 -
 158
158 -
 159
159 -
 160
160 -
 161
161 -
 162
162 -
 163
163 -
 164
164 -
 165
165 -
 166
166 -
 167
167 -
 168
168 -
 169
169 -
 170
170 -
171
-
172
-
173
-
174
-
175
-
176
-
177
-
178
-
179
-
180
-
181
-
182
-
183
-
184
-
185
-
186
-
187
-
188
-
189
-
190
-
191
-
192
-
193
-
194
-
195
-
196
-
197
-
198
-
199
-
200
-
201
-
202
-
203
-
204
-
205
-
206
-
207
-
208
-
209
-
210
-
211
-
212
-
213
-
214
-
215
-
216
-
217
-
218
-
219
-
220
-
221
-
222
-
223
-
224
-
225
-
226
-
227
-
228
-
229
-
230
-
231
-
232
-
233
-
234
-
235
-
236
-
237
-
238
-
239
-
240
 |
 |

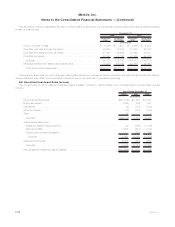
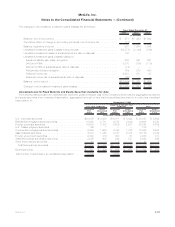
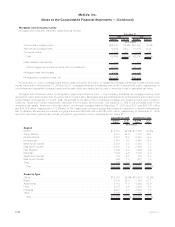
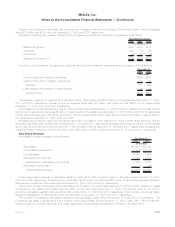
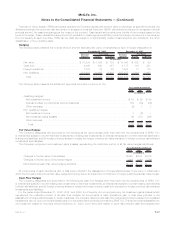
At December 31, 2008 and 2007, the Company’s gross unrealized losses related to its fixed maturity and equity securities of
$29.8 billion and $4.7 billion, respectively, were concentrated, calculated as a percentage of gross unrealized loss, as follows:
2008 2007
December 31,
Sector:
U.S.corporatesecurities ..................................................... 33% 44%
Foreigncorporatesecurities ................................................... 19 16
Residentialmortgage-backedsecurities............................................ 16 8
Asset-backedsecurities...................................................... 13 11
Commercialmortgage-backedsecurities ........................................... 11 4
Stateandpoliticalsubdivisionsecurities ........................................... 3 2
Foreigngovernmentsecurities.................................................. 1 4
Other.................................................................. 4 11
Total ................................................................. 100% 100%
Industry:
Mortgage-backed.......................................................... 27% 12%
Finance ................................................................ 24 33
Asset-backed............................................................. 13 11
Consumer............................................................... 11 3
Utility.................................................................. 8 8
Communication ........................................................... 5 2
Industrial................................................................ 4 19
Foreigngovernment......................................................... 1 4
Other.................................................................. 7 8
Total ................................................................. 100% 100%
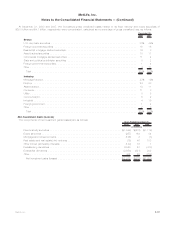
Net Investment Gains (Losses)
The components of net investment gains (losses) are as follows:
2008 2007 2006
Years Ended December 31,
(In millions)
Fixed maturity securities . . . . . . . . . . . . . . . . . . . . . . . . . . . . . . . . . . . . . . . . . . . . $(1,949) $(615) $(1,119)
Equitysecurities................................................. (257) 164 84
Mortgageandconsumerloans........................................ (136) 3 (8)
Realestateandrealestatejointventures................................. (18) 46 102
Otherlimitedpartnershipinterests ..................................... (140) 16 1
Freestandingderivatives............................................ 6,560 61 (410)
Embeddedderivatives ............................................. (2,650) (321) 202
Other........................................................ 402 68 (234)
Net investment gains (losses) . . . . . . . . . . . . . . . . . . . . . . . . . . . . . . . . . . . . . . . $ 1,812 $(578) $(1,382)
F-37MetLife, Inc.
MetLife, Inc.
Notes to the Consolidated Financial Statements — (Continued)