MetLife 2008 Annual Report Download - page 42
Download and view the complete annual report
Please find page 42 of the 2008 MetLife annual report below. You can navigate through the pages in the report by either clicking on the pages listed below, or by using the keyword search tool below to find specific information within the annual report.-
 1
1 -
2
-
3
-
4
-
5
-
6
-
7
-
8
-
9
-
10
-
11
-
12
-
13
-
14
-
15
-
16
-
17
-
18
-
19
-
20
-
21
-
22
-
23
-
24
-
25
-
26
-
27
-
28
-
29
-
30
-
31
-
 32
32 -
 33
33 -
 34
34 -
 35
35 -
 36
36 -
 37
37 -
 38
38 -
 39
39 -
 40
40 -
 41
41 -
 42
42 -
 43
43 -
 44
44 -
 45
45 -
 46
46 -
 47
47 -
 48
48 -
 49
49 -
 50
50 -
 51
51 -
 52
52 -
53
-
54
-
55
-
56
-
57
-
58
-
59
-
60
-
61
-
62
-
63
-
64
-
65
-
66
-
67
-
68
-
69
-
70
-
71
-
72
-
73
-
74
-
75
-
76
-
77
-
78
-
79
-
80
-
81
-
82
-
83
-
84
-
85
-
86
-
87
-
88
-
89
-
90
-
91
-
92
-
93
-
94
-
95
-
96
-
97
-
98
-
99
-
100
-
101
-
102
-
103
-
104
-
105
-
106
-
107
-
108
-
109
-
110
-
111
-
112
-
113
-
114
-
115
-
116
-
117
-
118
-
119
-
120
-
121
-
122
-
123
-
124
-
125
-
126
-
127
-
128
-
129
-
130
-
131
-
132
-
133
-
134
-
135
-
136
-
137
-
138
-
139
-
140
-
141
-
142
-
143
-
144
-
145
-
146
-
147
-
148
-
149
-
150
-
151
-
152
-
153
-
154
-
155
-
156
-
157
-
158
-
159
-
160
-
161
-
162
-
163
-
164
-
165
-
166
-
167
-
168
-
169
-
170
-
171
-
172
-
173
-
174
-
175
-
176
-
177
-
178
-
179
-
180
-
181
-
182
-
183
-
184
-
185
-
186
-
187
-
188
-
189
-
190
-
191
-
192
-
193
-
194
-
195
-
196
-
197
-
198
-
199
-
200
-
201
-
202
-
203
-
204
-
205
-
206
-
207
-
208
-
209
-
210
-
211
-
212
-
213
-
214
-
215
-
216
-
217
-
218
-
219
-
220
-
221
-
222
-
223
-
224
-
225
-
226
-
227
-
228
-
229
-
230
-
231
-
232
-
233
-
234
-
235
-
236
-
237
-
238
-
239
-
240
 |
 |
• Brazil, Belgium and Australia, each increased by $11 million, and Poland by $7 million primarily due to higher commissions related to
business growth.
• Taiwan by $5 million due to a refinement in DAC resulting from a refinement of methodologies related to the estimation of profit
emergence on certain blocks of business as well as growth.
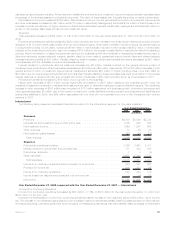
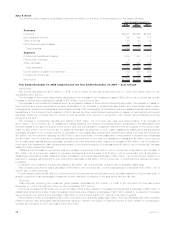
Year Ended December 31, 2007 compared with the Year Ended December 31, 2006 — International
Income from Continuing Operations
Income from continuing operations increased by $472 million, or 274%, to $644 million for the year ended December 31, 2007 from
$172 million for 2006. This increase includes the impact of net investment gains of $42 million, net of income tax.
Excluding the impact of net investment gains (losses), income from continuing operations increased by $430 million from 2006.
Income from continuing operations increased in:
• Argentina by $146 million, net of income tax, primarily due to a net reduction of liabilities by $48 million, net of income tax, resulting
from pension reform. Additionally, $66 million of a valuation allowance related to a deferred tax asset established in connection with
such pension reform liabilities was reduced, resulting in a commensurate increase in income from continuing operations. Under the
reform plan, fund administrators are no longer liable for death and disability claims of the plan participants; however, administrators
retain the obligation for administering certain existing and future participants’ accounts for which they receive no revenue. Also
contributing is the favorable impact of reductions in claim liabilities resulting from experience reviews in both years, higher premiums
primarily due to higher pension contributions attributable to higher participant salaries, higher net investment income resulting from
capital contributions in 2006, and a smaller increase in market indexed policyholder liabilities without a corresponding decrease in net
investment income, partially offset by the reduction of cost of insurance fees as a result of the new pension system reform regulation,
an increase in retention incentives related to pension reform, as well as lower trading portfolio income. Argentina also benefited, in
both years, from the utilization of tax loss carryforwards against which valuation allowances had previously been established, and in
2007 from the reduction of valuation allowances due to expected realizability of deferred tax assets.
• Mexico by $139 million, net of income tax, primarily due to a decrease in certain policyholder liabilities caused by a decrease in the
unrealized investment results on invested assets supporting those liabilities relative to 2006, the favorable impact of experience
refunds during the first quarter of 2007 in its institutional business, a reduction in claim liabilities resulting from experience reviews,
the adverse impact in 2006 of an adjustment for experience refunds in its institutional business, a year over year decrease in DAC
amortization as a result of management’s update of assumptions used to determine estimated gross profits in both years, a decrease
in liabilities based on a review of outstanding remittances, as well as growth in its institutional and universal life businesses. These
increases were offset by lower fees resulting from management’s update of assumptions used to determine estimated gross profits,
the favorable impact in 2006 associated with a large group policy that was not renewed by the policyholder, a decrease in various
one-time revenue items, lower investment yields, the favorable impact in 2006 of liabilities related to employment matters that were
reduced, and the benefit in 2006 from the elimination of liabilities for pending claims that were determined to be invalid following a
review.
• Taiwan by $51 million, net of income tax, primarily due to an increase in DAC amortization in 2006 due to a loss recognition
adjustment and prior year restructuring costs of $11 million associated with the termination of the agency distribution channel,
partially offset by the favorable impact of liability refinements in 2006 and higher policyholder liabilities related to loss recognition in
2006.
• Brazil by $37 million, net of income tax, due to the unfavorable impact of increases in policyholder liabilities due to higher than
expected mortality on specific blocks of business in 2006, an increase in litigation liabilities in 2006 and the unfavorable impact of the
reversal of a tax credit in 2006, as well as growth of the in-force business.
• Ireland by $19 million, net of income tax, primarily due to the utilization of net operating losses for which a valuation allowance had
been previously established as well as higher investment income resulting from higher invested assets from a capital contribution,
partially offset by higher start-up expenses and currency transaction losses.
• Japan by $22 million, net of income tax, due to improved hedge results and business growth, partially offset by the impact of foreign
currency transaction losses.
• Hong Kong by $9 million, net of income tax, due to the acquisition of the remaining 50% interest in MetLife Fubon and the resulting
consolidation of the operation, as well as business growth.
• Chile by $8 million, net of income tax, primarily due to continued growth of the in-force business, higher joint venture income and
higher returns on inflation indexed securities, partially offset by higher compensation, infrastructure and marketing expenses.
• The United Kingdom by $3 million, net of income tax, due to a reduction of claim liabilities resulting from an experience review, offset
by an unearned premium calculation refinement.
• Australia by $1 million, net of income tax, due to changes in foreign currency exchange rates offset by higher claims and business
growth.
Partially offsetting these increases, income from continuing operations decreased in:
• The home office by $9 million, net of income tax, due to higher economic capital charges and investment expenses of $16 million, net
of income tax, a $3 million increase in contingent tax expenses in 2007, as well as higher spending on growth and initiatives, partially
offset by the elimination of certain intercompany expenses previously charged to the International segment and a tax benefit
associated with a prior year income tax expense of $7 million related to a revision of an estimate.
• India by $3 million, net of income tax, primarily due to headcount increases and growth initiatives, as well as the impact of valuation
allowances established against losses in both years.
• South Korea by $4 million, net of income tax, due to a favorable impact in 2006 of $38 million, net of income tax, in DAC amortization
associated with the implementation of a more refined reserve valuation system, as well as additional expenses in 2007 associated
with growth and infrastructure initiatives, partially offset by continued growth in its variable universal life business, lower DAC
amortization in the variable universal life business due to favorable market performance and a lower increase in claim liabilities.
The remainder of the change in income from continuing operations can be attributed to contributions from the other countries.
39MetLife, Inc.