MetLife 2008 Annual Report Download - page 106
Download and view the complete annual report
Please find page 106 of the 2008 MetLife annual report below. You can navigate through the pages in the report by either clicking on the pages listed below, or by using the keyword search tool below to find specific information within the annual report.-
 1
1 -
2
-
3
-
4
-
5
-
6
-
7
-
8
-
9
-
10
-
11
-
12
-
13
-
14
-
15
-
16
-
17
-
18
-
19
-
20
-
21
-
22
-
23
-
24
-
25
-
26
-
27
-
28
-
29
-
30
-
31
-
32
-
33
-
34
-
35
-
36
-
37
-
38
-
39
-
40
-
41
-
42
-
43
-
44
-
45
-
46
-
47
-
48
-
49
-
50
-
51
-
52
-
53
-
54
-
55
-
56
-
57
-
58
-
59
-
60
-
61
-
62
-
63
-
64
-
65
-
66
-
67
-
68
-
69
-
70
-
71
-
72
-
73
-
74
-
75
-
76
-
77
-
78
-
79
-
80
-
81
-
82
-
83
-
84
-
85
-
86
-
87
-
88
-
89
-
90
-
91
-
92
-
93
-
94
-
95
-
 96
96 -
 97
97 -
 98
98 -
 99
99 -
 100
100 -
 101
101 -
 102
102 -
 103
103 -
 104
104 -
 105
105 -
 106
106 -
 107
107 -
 108
108 -
 109
109 -
 110
110 -
 111
111 -
 112
112 -
 113
113 -
 114
114 -
 115
115 -
 116
116 -
117
-
118
-
119
-
120
-
121
-
122
-
123
-
124
-
125
-
126
-
127
-
128
-
129
-
130
-
131
-
132
-
133
-
134
-
135
-
136
-
137
-
138
-
139
-
140
-
141
-
142
-
143
-
144
-
145
-
146
-
147
-
148
-
149
-
150
-
151
-
152
-
153
-
154
-
155
-
156
-
157
-
158
-
159
-
160
-
161
-
162
-
163
-
164
-
165
-
166
-
167
-
168
-
169
-
170
-
171
-
172
-
173
-
174
-
175
-
176
-
177
-
178
-
179
-
180
-
181
-
182
-
183
-
184
-
185
-
186
-
187
-
188
-
189
-
190
-
191
-
192
-
193
-
194
-
195
-
196
-
197
-
198
-
199
-
200
-
201
-
202
-
203
-
204
-
205
-
206
-
207
-
208
-
209
-
210
-
211
-
212
-
213
-
214
-
215
-
216
-
217
-
218
-
219
-
220
-
221
-
222
-
223
-
224
-
225
-
226
-
227
-
228
-
229
-
230
-
231
-
232
-
233
-
234
-
235
-
236
-
237
-
238
-
239
-
240
 |
 |

The Company’s carrying value of real estate held-for-sale of $1 million and $39 million at December 31, 2008 and 2007, respectively,
have been reduced by impairments of $1 million at both December 31, 2008 and 2007, respectively.
The Company records real estate acquired upon foreclosure of commercial and agricultural mortgage loans at the lower of estimated
fair value or the carrying value of the mortgage loan at the date of foreclosure.
Net investment income from real estate joint ventures and funds within the real estate and real estate joint venture caption represents
distributions from investees accounted for under the cost method and equity in earnings from investees accounted for under the equity
method. For the years ended December 31, 2008, 2007 and 2006, net investment income from real estate and real estate joint ventures
was $581 million, $950 million and $777 million, respectively. Net investment income from real estate and real estate joint ventures
decreased by $369 million for the year ended 2008 due to volatility in the real estate markets. Management anticipates that the significant
volatility in the real estate markets will continue in 2009 which could continue to impact net investment income and the related yields on real
estate and real estate joint ventures. For equity method real estate joint ventures and funds, the Company reports the equity in earnings
based on the availability of financial statements and other periodic financial information that are substantially the same as financial
statements. Accordingly, those financial statements are reviewed on a lag basis after the close of the joint ventures’ or funds’ financial
reporting periods, and the Company records the equity in earnings, generally on a one reporting period lag. In addition, due to the lag in
reporting of the joint ventures’ and funds’ results to the Company, volatility in the equity and credit markets experienced in late 2008, is
expected to unfavorably impact net investment income in 2009, as those results are reported to the Company.
Other Limited Partnership Interests
The carrying value of other limited partnership interests (which primarily represent ownership interests in pooled investment funds that
principally make private equity investments in companies in the United States and overseas) was $6.0 billion and $6.2 billion at
December 31, 2008 and 2007, respectively. Included within other limited partnership interests at December 31, 2008 and 2007 are
$1.3 billion and $1.6 billion, respectively, of hedge funds. The Company uses the equity method of accounting for investments in limited
partnership interests in which it has more than a minor interest, has influence over the partnership’s operating and financial policies, but
does not have a controlling interest and is not the primary beneficiary. The Company uses the cost method for minor interest investments
and when it has virtually no influence over the partnership’s operating and financial policies. For equity method limited partnership interests,
the Company reports the equity in earnings based on the availability of financial statements and other periodic financial information that are
substantially the same as financial statements. Accordingly, those financial statements are reviewed on a lag basis after the close of the
partnerships’ financial reporting periods, and the Company records the equity in earnings, generally on a one reporting period lag. In
addition, due to the lag in reporting of the partnerships’ results to the Company, volatility in the equity and credit markets experienced in
late 2008, is expected to unfavorably impact net investment income in 2009, as those results are reported to the Company. The
Company’s investments in other limited partnership interests represented 1.9% and 1.9% of cash and invested assets at December 31,
2008 and 2007, respectively.
For the years ended December 31, 2008, 2007 and 2006, net investment income (loss) from other limited partnership interests was
($170) million, $1,309 million and $945 million, respectively. Net investment income from other limited partnership interests, including
hedge funds, decreased by $1,479 million for the year ended 2008, due to volatility in the equity and credit markets. Management
anticipates that the significant volatility in the equity and credit markets will continue in 2009 which could continue to impact net investment
income and the related yields on other limited partnership interests. In addition, due to the lag in reporting of the partnership results to the
Company, volatility in the equity and credit markets incurred in late 2008, is expected to unfavorably impact net investment income in 2009,
as those results are reported to the Company.
At December 31, 2008, the Company held $137 million in cost basis other limited partnership interests which were impaired during the
year ended December 31, 2008 based on the underlying limited partnership financial statements. Consistent with equity securities, greater
weight and consideration is given in the other limited partnership interests impairment review process, to the severity and duration of
unrealized losses on such other limited partnership interests holdings. These other limited partnership interests were recorded at estimated
fair value and represent a nonrecurring fair value measurement. The estimated fair value was categorized as Level 3. Included within net
investment gains (losses) for such other limited partnerships are impairments of $105 million for the year ended December 31, 2008.
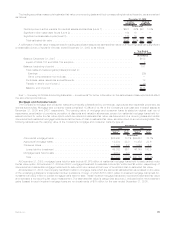
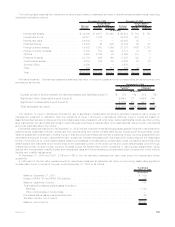
Other Invested Assets
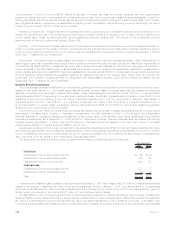
The following table presents the carrying value of the Company’s other invested assets at:
Type Carrying
Value %of
Total Carrying
Value %of
Total
2008 2007
December 31,
(In millions)
Freestandingderivativeswithpositivefairvalues...................... $12,306 71.3% $4,036 50.0%
Leveragedleases,netofnon-recoursedebt ........................ 2,146 12.4 2,059 25.5
Jointventureinvestments..................................... 751 4.4 622 7.7
Taxcreditpartnerships ...................................... 503 2.9 — —
Fundingagreements........................................ 394 2.3 383 4.7
Mortgageservicingrights..................................... 191 1.1 — —
Fundswithheld ........................................... 62 0.4 80 1.0
Other.................................................. 895 5.2 896 11.1
Total . . . . . . . . . . . . . . . . . . . . . . . . . . . . . . . . . . . . . . . . . . . . . . . . . $17,248 100.0% $8,076 100.0%
See — “Derivative Financial Instruments” regarding the freestanding derivatives with positive estimated fair values. Joint venture
investments accounted for on the equity method and represent our investment in insurance underwriting joint ventures in Japan, Chile and
China. Tax credit partnerships are established for the purpose of investing in low-income housing and other social causes, where the
103MetLife, Inc.