MetLife 2008 Annual Report Download - page 102
Download and view the complete annual report
Please find page 102 of the 2008 MetLife annual report below. You can navigate through the pages in the report by either clicking on the pages listed below, or by using the keyword search tool below to find specific information within the annual report.-
 1
1 -
2
-
3
-
4
-
5
-
6
-
7
-
8
-
9
-
10
-
11
-
12
-
13
-
14
-
15
-
16
-
17
-
18
-
19
-
20
-
21
-
22
-
23
-
24
-
25
-
26
-
27
-
28
-
29
-
30
-
31
-
32
-
33
-
34
-
35
-
36
-
37
-
38
-
39
-
40
-
41
-
42
-
43
-
44
-
45
-
46
-
47
-
48
-
49
-
50
-
51
-
52
-
53
-
54
-
55
-
56
-
57
-
58
-
59
-
60
-
61
-
62
-
63
-
64
-
65
-
66
-
67
-
68
-
69
-
70
-
71
-
72
-
73
-
74
-
75
-
76
-
77
-
78
-
79
-
80
-
81
-
82
-
83
-
84
-
85
-
86
-
87
-
88
-
89
-
90
-
91
-
 92
92 -
 93
93 -
 94
94 -
 95
95 -
 96
96 -
 97
97 -
 98
98 -
 99
99 -
 100
100 -
 101
101 -
 102
102 -
 103
103 -
 104
104 -
 105
105 -
 106
106 -
 107
107 -
 108
108 -
 109
109 -
 110
110 -
 111
111 -
 112
112 -
113
-
114
-
115
-
116
-
117
-
118
-
119
-
120
-
121
-
122
-
123
-
124
-
125
-
126
-
127
-
128
-
129
-
130
-
131
-
132
-
133
-
134
-
135
-
136
-
137
-
138
-
139
-
140
-
141
-
142
-
143
-
144
-
145
-
146
-
147
-
148
-
149
-
150
-
151
-
152
-
153
-
154
-
155
-
156
-
157
-
158
-
159
-
160
-
161
-
162
-
163
-
164
-
165
-
166
-
167
-
168
-
169
-
170
-
171
-
172
-
173
-
174
-
175
-
176
-
177
-
178
-
179
-
180
-
181
-
182
-
183
-
184
-
185
-
186
-
187
-
188
-
189
-
190
-
191
-
192
-
193
-
194
-
195
-
196
-
197
-
198
-
199
-
200
-
201
-
202
-
203
-
204
-
205
-
206
-
207
-
208
-
209
-
210
-
211
-
212
-
213
-
214
-
215
-
216
-
217
-
218
-
219
-
220
-
221
-
222
-
223
-
224
-
225
-
226
-
227
-
228
-
229
-
230
-
231
-
232
-
233
-
234
-
235
-
236
-
237
-
238
-
239
-
240
 |
 |

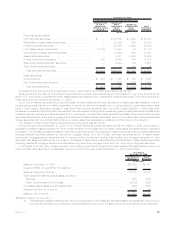
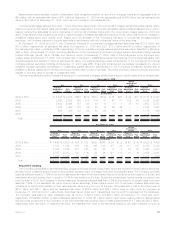
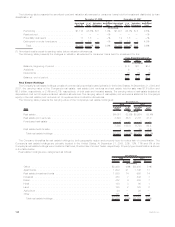
The trading securities measured at estimated fair value on a recurring basis and their corresponding fair value hierarchy, are summarized
as follows:
Trading
Securities Trading
Liabilities
December 31, 2008
(In millions)
Quoted prices in active markets for identical assets and liabilities (Level 1) . . . . . . . . . . . . $587 62% $57 100%
Significantotherobservableinputs(Level2)................................ 184 19 — —
Significantunobservableinputs(Level3) .................................. 175 19 — —
Totalestimatedfairvalue........................................... $946 100% $57 100%
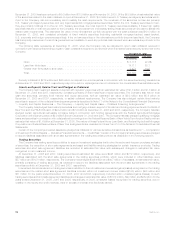
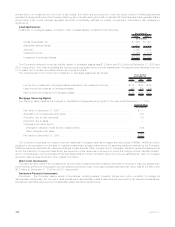
A rollforward of the fair value measurements for trading securities measured at estimated fair value on a recurring basis using significant
unobservable (Level 3) inputs for the year ended December 31, 2008 is as follows:
Year Ended
December 31, 2008
(In millions)
Balance, December 31, 2007 . . . . . . . . . . . . . . . . . . . . . . . . . . . . . . . . . . . . . . . . . . . . . . . $183
ImpactofSFAS157andSFAS159adoption .................................... 8
Balance,beginningofperiod................................................ 191
Total realized/unrealized gains (losses) included in:
Earnings .......................................................... (26)
Othercomprehensiveincome(loss)......................................... —
Purchases,sales,issuancesandsettlements.................................... 18
Transferinand/oroutofLevel3 ............................................ (8)
Balance,endofperiod .................................................. $175
See “— Summary of Critical Accounting Estimates — Investments” for further information on the estimates and assumptions that affect
the amounts reported above.
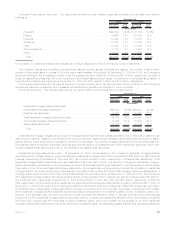
Mortgage and Consumer Loans
The Company’s mortgage and consumer loans are principally collateralized by commercial, agricultural and residential properties, as
well as automobiles. Mortgage and consumer loans comprised 15.9% and 14.1% of the Company’s total cash and invested assets at
December 31, 2008 and 2007, respectively. The carrying value of mortgage and consumer loans is stated at original cost net of
repayments, amortization of premiums, accretion of discounts and valuation allowances, except for residential mortgage loans held-for-
sale accounted for under the fair value option which are carried at estimated fair value, as determined on a recurring basis and certain
commercial and residential mortgage loans carried at the lower of cost or estimated fair value, as determined on a nonrecurring basis. The
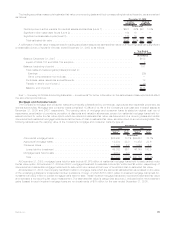
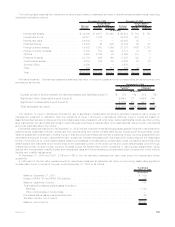
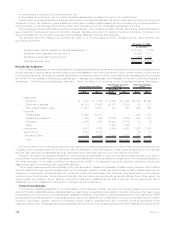
following table shows the carrying value of the Company’s mortgage and consumer loans by type at:
Carrying
Value %of
Total Carrying
Value %of
Total
2008 2007
(In millions)
December 31,
Commercialmortgageloans .................................. $35,965 70.1% $34,657 75.1%
Agriculturalmortgageloans................................... 12,234 23.8 10,452 22.6
Consumerloans.......................................... 1,153 2.2 1,040 2.3
Loans held-for-investment . . . . . . . . . . . . . . . . . . . . . . . . . . . . . . . . . . 49,352 96.1 46,149 100.0
Mortgageloansheld-for-sale.................................. 2,012 3.9 5 —
Total . . . . . . . . . . . . . . . . . . . . . . . . . . . . . . . . . . . . . . . . . . . . . . . . $51,364 100.0% $46,154 100.0%
At December 31, 2008, mortgage loans held-for-sale include $1,975 million of residential mortgage loans held-for-sale carried under
the fair value option. At December 31, 2008 and 2007, mortgage loans held-for-sale also include $37 million and $5 million, respectively, of
commercial and residential mortgage loans held-for-sale which are carried at the lower of amortized cost or estimated fair value.
At December 31, 2008, the Company held $220 million in mortgage loans which are carried at estimated fair value based on the value
of the underlying collateral or independent broker quotations, if lower, of which $188 million relate to impaired mortgage loans held-for-
investment and $32 million to certain mortgage loans held-for-sale. These impaired mortgage loans were recorded at estimated fair value
and represent a nonrecurring fair value measurement. The estimated fair value is categorized as Level 3. Included within net investment
gains (losses) for such impaired mortgage loans are net impairments of $79 million for the year ended December 31, 2008.
99MetLife, Inc.