MetLife 2008 Annual Report Download - page 91
Download and view the complete annual report
Please find page 91 of the 2008 MetLife annual report below. You can navigate through the pages in the report by either clicking on the pages listed below, or by using the keyword search tool below to find specific information within the annual report.-
 1
1 -
2
-
3
-
4
-
5
-
6
-
7
-
8
-
9
-
10
-
11
-
12
-
13
-
14
-
15
-
16
-
17
-
18
-
19
-
20
-
21
-
22
-
23
-
24
-
25
-
26
-
27
-
28
-
29
-
30
-
31
-
32
-
33
-
34
-
35
-
36
-
37
-
38
-
39
-
40
-
41
-
42
-
43
-
44
-
45
-
46
-
47
-
48
-
49
-
50
-
51
-
52
-
53
-
54
-
55
-
56
-
57
-
58
-
59
-
60
-
61
-
62
-
63
-
64
-
65
-
66
-
67
-
68
-
69
-
70
-
71
-
72
-
73
-
74
-
75
-
76
-
77
-
78
-
79
-
80
-
 81
81 -
 82
82 -
 83
83 -
 84
84 -
 85
85 -
 86
86 -
 87
87 -
 88
88 -
 89
89 -
 90
90 -
 91
91 -
 92
92 -
 93
93 -
 94
94 -
 95
95 -
 96
96 -
 97
97 -
 98
98 -
 99
99 -
 100
100 -
 101
101 -
102
-
103
-
104
-
105
-
106
-
107
-
108
-
109
-
110
-
111
-
112
-
113
-
114
-
115
-
116
-
117
-
118
-
119
-
120
-
121
-
122
-
123
-
124
-
125
-
126
-
127
-
128
-
129
-
130
-
131
-
132
-
133
-
134
-
135
-
136
-
137
-
138
-
139
-
140
-
141
-
142
-
143
-
144
-
145
-
146
-
147
-
148
-
149
-
150
-
151
-
152
-
153
-
154
-
155
-
156
-
157
-
158
-
159
-
160
-
161
-
162
-
163
-
164
-
165
-
166
-
167
-
168
-
169
-
170
-
171
-
172
-
173
-
174
-
175
-
176
-
177
-
178
-
179
-
180
-
181
-
182
-
183
-
184
-
185
-
186
-
187
-
188
-
189
-
190
-
191
-
192
-
193
-
194
-
195
-
196
-
197
-
198
-
199
-
200
-
201
-
202
-
203
-
204
-
205
-
206
-
207
-
208
-
209
-
210
-
211
-
212
-
213
-
214
-
215
-
216
-
217
-
218
-
219
-
220
-
221
-
222
-
223
-
224
-
225
-
226
-
227
-
228
-
229
-
230
-
231
-
232
-
233
-
234
-
235
-
236
-
237
-
238
-
239
-
240
 |
 |

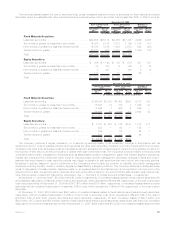
respectively. In addition, the Company held $46 million and $57 million at estimated fair values, respectively, at December 31, 2008 and
2007 of other perpetual hybrid securities, primarily U.S. financial institutions, included in fixed maturity securities.
(3) At December 31, 2008 and 2007 the Company also held $2,052 million and $3,432 million at estimated fair value, respectively, of
redeemable preferred stock which have stated maturity dates which are included within fixed maturity securities. These securities are
primarily issued by U.S. financial institutions, have cumulative interest deferral features and are commonly referred to as “capital
securities” within U.S. corporate securities.
Concentrations of Credit Risk. The Company is not exposed to any significant concentrations of credit risk of any single issuer greater
than 10% of the Company’s stockholders’ in its equity securities portfolio.
The Company is not exposed to any concentrations of credit risk of any single issuer greater than 10% of the Company’s stockholders’
equity, other than securities of the U.S. government and certain U.S. government agencies. At December 31, 2008 and 2007, the
Company’s holdings in U.S. Treasury and agency fixed maturity securities at estimated fair value were $21.3 billion and $21.2 billion,
respectively. As shown in the sector table above, at December 31, 2008 the Company’s three largest exposures in its fixed maturity
security portfolio were U.S. corporate fixed maturity securities (33.6%), residential mortgage-backed securities (19.2%), and foreign
corporate securities (15.8%); and at December 31, 2007 were U.S. corporate fixed maturity securities (31.8%), residential mortgage-
backed securities (23.7%), and foreign corporate securities (16.0%). Additionally, at December 31, 2008 and 2007, the Company had
exposure to fixed maturity securities backed by sub-prime mortgages with estimated fair values of $1.1 billion and $2.0 billion, respectively,
and unrealized losses of $730 million and $198 million, respectively. These securities are classified within asset-backed securities in the
immediately preceding table.
See also “— Investments — Fixed Maturity and Equity Securities Available-for-Sale — Corporate Fixed Maturity Securities” and
“— Structured Securities” for a description of concentrations of credit risk related to these asset subsectors.
At December 31, 2008, the Company’s direct investments in fixed maturity securities and equity securities in Lehman Brothers Holdings
Inc. (“Lehman”), Washington Mutual, Inc. (“Washington Mutual”) and American International Group, Inc. (“AIG”) have an aggregate carrying
value (after impairments) of approximately $360 million. In addition, the Company has made secured loans to affiliates of Lehman which are
fully collateralized. See also “— Investments — Fixed Maturity and Equity Securities Available-for-Sale — Impairments.”
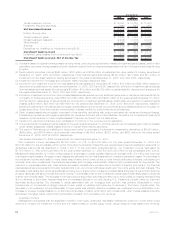
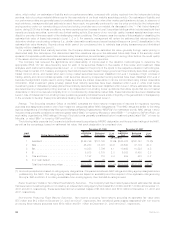
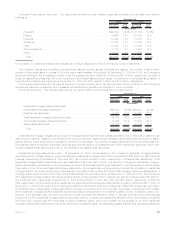
Fair Value Hierarchy. Fixed maturity securities and equity securities measured at estimated fair value on a recurring basis and their
corresponding fair value sources and fair value hierarchy, are summarized as follows:
December 31, 2008
Fixed Maturity
Securities Equity
Securities
(In millions)
Quoted prices in active markets for identical assets (Level 1) . . . . . . . . . . . . . $ 10,414 5.5% $ 413 12.9%
Independent pricing source . . . . . . . . . . . . . . . . . . . . . . . . . . . . . . . . . . . 133,620 71.0 402 12.6
Internal matrix pricing or discounted cash flow techniques . . . . . . . . . . . . . . . 26,809 14.2 1,003 31.4
Significant other observable inputs (Level 2) . . . . . . . . . . . . . . . . . . . . . . . . 160,429 85.2 1,405 44.0
Independentpricingsource................................... 7,423 3.9 779 24.4
Internal matrix pricing or discounted cash flow techniques . . . . . . . . . . . . . . . 7,443 4.0 397 12.4
Independentbrokerquotations................................. 2,542 1.4 203 6.3
Significantunobservableinputs(Level3) .......................... 17,408 9.3 1,379 43.1
Total estimated fair value . . . . . . . . . . . . . . . . . . . . . . . . . . . . . . . . . . . . $188,251 100.0% $3,197 100.0%
88 MetLife, Inc.