MetLife 2008 Annual Report Download - page 219
Download and view the complete annual report
Please find page 219 of the 2008 MetLife annual report below. You can navigate through the pages in the report by either clicking on the pages listed below, or by using the keyword search tool below to find specific information within the annual report.-
 1
1 -
2
-
3
-
4
-
5
-
6
-
7
-
8
-
9
-
10
-
11
-
12
-
13
-
14
-
15
-
16
-
17
-
18
-
19
-
20
-
21
-
22
-
23
-
24
-
25
-
26
-
27
-
28
-
29
-
30
-
31
-
32
-
33
-
34
-
35
-
36
-
37
-
38
-
39
-
40
-
41
-
42
-
43
-
44
-
45
-
46
-
47
-
48
-
49
-
50
-
51
-
52
-
53
-
54
-
55
-
56
-
57
-
58
-
59
-
60
-
61
-
62
-
63
-
64
-
65
-
66
-
67
-
68
-
69
-
70
-
71
-
72
-
73
-
74
-
75
-
76
-
77
-
78
-
79
-
80
-
81
-
82
-
83
-
84
-
85
-
86
-
87
-
88
-
89
-
90
-
91
-
92
-
93
-
94
-
95
-
96
-
97
-
98
-
99
-
100
-
101
-
102
-
103
-
104
-
105
-
106
-
107
-
108
-
109
-
110
-
111
-
112
-
113
-
114
-
115
-
116
-
117
-
118
-
119
-
120
-
121
-
122
-
123
-
124
-
125
-
126
-
127
-
128
-
129
-
130
-
131
-
132
-
133
-
134
-
135
-
136
-
137
-
138
-
139
-
140
-
141
-
142
-
143
-
144
-
145
-
146
-
147
-
148
-
149
-
150
-
151
-
152
-
153
-
154
-
155
-
156
-
157
-
158
-
159
-
160
-
161
-
162
-
163
-
164
-
165
-
166
-
167
-
168
-
169
-
170
-
171
-
172
-
173
-
174
-
175
-
176
-
177
-
178
-
179
-
180
-
181
-
182
-
183
-
184
-
185
-
186
-
187
-
188
-
189
-
190
-
191
-
192
-
193
-
194
-
195
-
196
-
197
-
198
-
199
-
200
-
201
-
202
-
203
-
204
-
205
-
206
-
207
-
208
-
 209
209 -
 210
210 -
 211
211 -
 212
212 -
 213
213 -
 214
214 -
 215
215 -
 216
216 -
 217
217 -
 218
218 -
 219
219 -
 220
220 -
 221
221 -
 222
222 -
 223
223 -
 224
224 -
 225
225 -
 226
226 -
 227
227 -
 228
228 -
 229
229 -
230
-
231
-
232
-
233
-
234
-
235
-
236
-
237
-
238
-
239
-
240
 |
 |

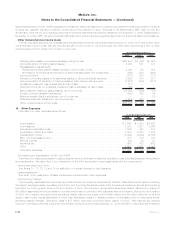
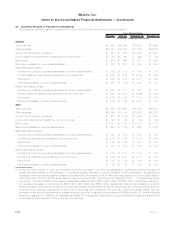
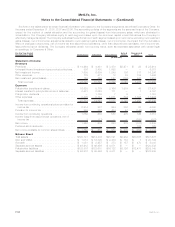
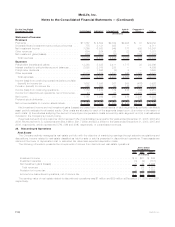
For the Year Ended
December 31, 2006 Institutional Individual International Auto &
Home Corporate &
Other Total
(In millions)
Statement of Income:
Revenues
Premiums................................ $11,867 $ 4,502 $2,722 $2,924 $ 37 $22,052
Universal life and investment-type product policy fees . . . 775 3,131 805 — — 4,711
Net investment income . . . . . . . . . . . . . . . . . . . . . . . 7,260 6,863 949 177 998 16,247
Otherrevenues ............................ 684 524 28 22 43 1,301
Netinvestmentgains(losses) ................... (630) (591) (10) 3 (154) (1,382)
Totalrevenues ........................... 19,956 14,429 4,494 3,126 924 42,929
Expenses
Policyholder benefits and claims . . . . . . . . . . . . . . . . . 13,368 5,335 2,411 1,717 38 22,869
Interest credited to policyholder account balances . . . . . . 2,593 2,018 288 — — 4,899
Policyholderdividends........................ — 1,696 (3) 5 — 1,698
Otherexpenses............................ 2,313 3,485 1,531 846 1,362 9,537
Total expenses . . . . . . . . . . . . . . . . . . . . . . . . . . . 18,274 12,534 4,227 2,568 1,400 39,003
Income (loss) from continuing operations before provision
(benefit)forincometax...................... 1,682 1,895 267 558 (476) 3,926
Provision(benefit)forincometax................. 563 653 95 142 (437) 1,016
Income (loss) from continuing operations . . . . . . . . . . . . 1,119 1,242 172 416 (39) 2,910
Income from discontinued operations, net of income tax . . 48 22 28 — 3,285 3,383
Netincome............................... 1,167 1,264 200 416 3,246 6,293
Preferredstockdividends...................... — — — — 134 134
Net income available to common shareholders . . . . . . . . $ 1,167 $ 1,264 $ 200 $ 416 $3,112 $ 6,159
Net investment income and net investment gains (losses) are based upon the actual results of each segment’s specifically identifiable
asset portfolio adjusted for allocated equity. Other costs are allocated to each of the segments based upon: (i) a review of the nature of
such costs; (ii) time studies analyzing the amount of employee compensation costs incurred by each segment; and (iii) cost estimates
included in the Company’s product pricing.
Revenues derived from any customer did not exceed 10% of consolidated revenues for the years ended December 31, 2008, 2007 and
2006. Revenues from U.S. operations were $44.6 billion, $41.7 billion and $38.4 billion for the years ended December 31, 2008, 2007 and
2006, respectively, which represented 87%, 88% and 90%, respectively, of consolidated revenues.
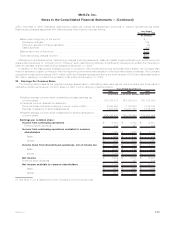
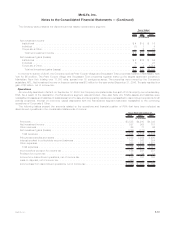
23. Discontinued Operations
Real Estate
The Company actively manages its real estate portfolio with the objective of maximizing earnings through selective acquisitions and
dispositions. Income related to real estate classified as held-for-sale or sold is presented in discontinued operations. These assets are
carried at the lower of depreciated cost or estimated fair value less expected disposition costs.
The following information presents the components of income from discontinued real estate operations:
2008 2007 2006
Years Ended
December 31,
(In millions)
Investmentincome........................................................ $ 6 $21 $ 243
Investmentexpense ....................................................... (3) (9) (151)
Netinvestmentgains(losses)................................................. 8 13 4,795
Totalrevenues ......................................................... 11 25 4,887
Provisionforincometax .................................................... 4 11 1,725
Incomefromdiscontinuedoperations,netofincometax................................ $ 7 $14 $3,162
The carrying value of real estate related to discontinued operations was $1 million and $39 million at December 31, 2008 and 2007,
respectively.
F-96 MetLife, Inc.
MetLife, Inc.
Notes to the Consolidated Financial Statements — (Continued)