MetLife 2008 Annual Report Download - page 103
Download and view the complete annual report
Please find page 103 of the 2008 MetLife annual report below. You can navigate through the pages in the report by either clicking on the pages listed below, or by using the keyword search tool below to find specific information within the annual report.-
 1
1 -
2
-
3
-
4
-
5
-
6
-
7
-
8
-
9
-
10
-
11
-
12
-
13
-
14
-
15
-
16
-
17
-
18
-
19
-
20
-
21
-
22
-
23
-
24
-
25
-
26
-
27
-
28
-
29
-
30
-
31
-
32
-
33
-
34
-
35
-
36
-
37
-
38
-
39
-
40
-
41
-
42
-
43
-
44
-
45
-
46
-
47
-
48
-
49
-
50
-
51
-
52
-
53
-
54
-
55
-
56
-
57
-
58
-
59
-
60
-
61
-
62
-
63
-
64
-
65
-
66
-
67
-
68
-
69
-
70
-
71
-
72
-
73
-
74
-
75
-
76
-
77
-
78
-
79
-
80
-
81
-
82
-
83
-
84
-
85
-
86
-
87
-
88
-
89
-
90
-
91
-
92
-
 93
93 -
 94
94 -
 95
95 -
 96
96 -
 97
97 -
 98
98 -
 99
99 -
 100
100 -
 101
101 -
 102
102 -
 103
103 -
 104
104 -
 105
105 -
 106
106 -
 107
107 -
 108
108 -
 109
109 -
 110
110 -
 111
111 -
 112
112 -
 113
113 -
114
-
115
-
116
-
117
-
118
-
119
-
120
-
121
-
122
-
123
-
124
-
125
-
126
-
127
-
128
-
129
-
130
-
131
-
132
-
133
-
134
-
135
-
136
-
137
-
138
-
139
-
140
-
141
-
142
-
143
-
144
-
145
-
146
-
147
-
148
-
149
-
150
-
151
-
152
-
153
-
154
-
155
-
156
-
157
-
158
-
159
-
160
-
161
-
162
-
163
-
164
-
165
-
166
-
167
-
168
-
169
-
170
-
171
-
172
-
173
-
174
-
175
-
176
-
177
-
178
-
179
-
180
-
181
-
182
-
183
-
184
-
185
-
186
-
187
-
188
-
189
-
190
-
191
-
192
-
193
-
194
-
195
-
196
-
197
-
198
-
199
-
200
-
201
-
202
-
203
-
204
-
205
-
206
-
207
-
208
-
209
-
210
-
211
-
212
-
213
-
214
-
215
-
216
-
217
-
218
-
219
-
220
-
221
-
222
-
223
-
224
-
225
-
226
-
227
-
228
-
229
-
230
-
231
-
232
-
233
-
234
-
235
-
236
-
237
-
238
-
239
-
240
 |
 |

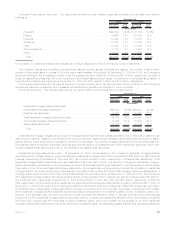
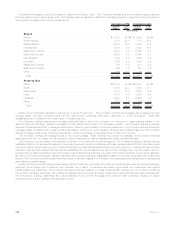
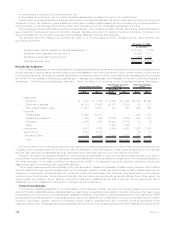
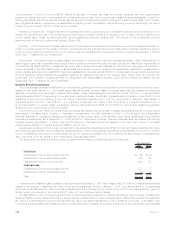
Commercial Mortgage Loans By Geographic Region and Property Type. The Company diversifies its commercial mortgage loans by
both geographic region and property type. The following table presents the distribution across geographic regions and property types for
commercial mortgage loans held-for-investment at:
Carrying
Value %of
Total Carrying
Value %of
Total
December 31, 2008 December 31, 2007
(In millions)
Region
Pacific ................................................ $ 8,837 24.6% $ 8,436 24.4%
SouthAtlantic............................................ 8,101 22.5 7,770 22.4
MiddleAtlantic ........................................... 5,931 16.5 5,042 14.5
International............................................. 3,414 9.5 3,642 10.5
WestSouthCentral........................................ 3,070 8.5 2,888 8.3
EastNorthCentral......................................... 2,591 7.2 2,866 8.3
NewEngland............................................ 1,529 4.3 1,464 4.2
Mountain............................................... 1,052 2.9 1,002 2.9
WestNorthCentral ........................................ 716 2.0 974 2.8
EastSouthCentral ........................................ 468 1.3 481 1.4
Other................................................. 256 0.7 92 0.3
Total . . . . . . . . . . . . . . . . . . . . . . . . . . . . . . . . . . . . . . . . . . . . . . . . $35,965 100.0% $34,657 100.0%
Property Type
Office................................................. $15,307 42.6% $15,216 43.9%
Retail................................................. 8,038 22.3 7,334 21.1
Apartments ............................................. 4,113 11.4 4,368 12.6
Hotel ................................................. 3,078 8.6 3,258 9.4
Industrial............................................... 2,901 8.1 2,622 7.6
Other................................................. 2,528 7.0 1,859 5.4
Total . . . . . . . . . . . . . . . . . . . . . . . . . . . . . . . . . . . . . . . . . . . . . . . . $35,965 100.0% $34,657 100.0%
Restructured, Potentially Delinquent, Delinquent or Under Foreclosure. The Company monitors its mortgage loan investments on an
ongoing basis, including reviewing loans that are restructured, potentially delinquent, delinquent or under foreclosure. These loan
classifications are consistent with those used in industry practice.
The Company defines restructured mortgage loans as loans in which the Company, for economic or legal reasons related to the
debtor’s financial difficulties, grants a concession to the debtor that it would not otherwise consider. The Company defines potentially
delinquent loans as loans that, in management’s opinion, have a high probability of becoming delinquent. The Company defines delinquent
mortgage loans, consistent with industry practice, as loans in which two or more interest or principal payments are past due. The Company
defines mortgage loans under foreclosure as loans in which foreclosure proceedings have formally commenced.
The Company reviews all mortgage loans on an ongoing basis. These reviews may include an analysis of the property financial
statements and rent roll, lease rollover analysis, property inspections, market analysis and tenant creditworthiness.
The Company records valuation allowances for certain of the loans that it deems impaired. The Company’s valuation allowances are
established both on a loan specific basis for those loans where a property or market specific risk has been identified that could likely result
in a future default, as well as for pools of loans with similar high risk characteristics where a property specific or market risk has not been
identified. Loan specific valuation allowances are established for the excess carrying value of the mortgage loan over the present value of
expected future cash flows discounted at the loan’s original effective interest rate, the value of the loan’s collateral, or the loan’s estimated
fair value if the loan is being sold. Valuation allowances for pools of loans are established based on property types and loan to value risk
factors. The Company records valuation allowances as investment losses. The Company records subsequent adjustments to allowances
as investment gains (losses).
Recent economic events causing deteriorating market conditions, low levels of liquidity and credit spread widening have all adversely
impacted the mortgage and consumer loan markets. As a result, commercial real estate, agricultural and residential loan market
fundamentals have weakened. The Company expects continued pressure on these fundamentals, including but not limited to declining
rent growth, increased vacancies, rising delinquencies and declining property values. These deteriorating factors have been considered in
the Company’s ongoing, systematic and comprehensive review of the mortgage and consumer loan portfolios, resulting in higher
writedown amounts and valuation allowances for 2008.
100 MetLife, Inc.