MetLife 2008 Annual Report Download - page 205
Download and view the complete annual report
Please find page 205 of the 2008 MetLife annual report below. You can navigate through the pages in the report by either clicking on the pages listed below, or by using the keyword search tool below to find specific information within the annual report.-
 1
1 -
2
-
3
-
4
-
5
-
6
-
7
-
8
-
9
-
10
-
11
-
12
-
13
-
14
-
15
-
16
-
17
-
18
-
19
-
20
-
21
-
22
-
23
-
24
-
25
-
26
-
27
-
28
-
29
-
30
-
31
-
32
-
33
-
34
-
35
-
36
-
37
-
38
-
39
-
40
-
41
-
42
-
43
-
44
-
45
-
46
-
47
-
48
-
49
-
50
-
51
-
52
-
53
-
54
-
55
-
56
-
57
-
58
-
59
-
60
-
61
-
62
-
63
-
64
-
65
-
66
-
67
-
68
-
69
-
70
-
71
-
72
-
73
-
74
-
75
-
76
-
77
-
78
-
79
-
80
-
81
-
82
-
83
-
84
-
85
-
86
-
87
-
88
-
89
-
90
-
91
-
92
-
93
-
94
-
95
-
96
-
97
-
98
-
99
-
100
-
101
-
102
-
103
-
104
-
105
-
106
-
107
-
108
-
109
-
110
-
111
-
112
-
113
-
114
-
115
-
116
-
117
-
118
-
119
-
120
-
121
-
122
-
123
-
124
-
125
-
126
-
127
-
128
-
129
-
130
-
131
-
132
-
133
-
134
-
135
-
136
-
137
-
138
-
139
-
140
-
141
-
142
-
143
-
144
-
145
-
146
-
147
-
148
-
149
-
150
-
151
-
152
-
153
-
154
-
155
-
156
-
157
-
158
-
159
-
160
-
161
-
162
-
163
-
164
-
165
-
166
-
167
-
168
-
169
-
170
-
171
-
172
-
173
-
174
-
175
-
176
-
177
-
178
-
179
-
180
-
181
-
182
-
183
-
184
-
185
-
186
-
187
-
188
-
189
-
190
-
191
-
192
-
193
-
194
-
 195
195 -
 196
196 -
 197
197 -
 198
198 -
 199
199 -
 200
200 -
 201
201 -
 202
202 -
 203
203 -
 204
204 -
 205
205 -
 206
206 -
 207
207 -
 208
208 -
 209
209 -
 210
210 -
 211
211 -
 212
212 -
 213
213 -
 214
214 -
 215
215 -
216
-
217
-
218
-
219
-
220
-
221
-
222
-
223
-
224
-
225
-
226
-
227
-
228
-
229
-
230
-
231
-
232
-
233
-
234
-
235
-
236
-
237
-
238
-
239
-
240
 |
 |

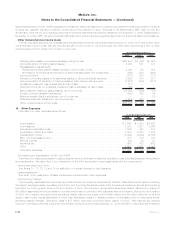
The assumed healthcare cost trend rates used in measuring the APBO and net periodic benefit cost were as follows:
2008 2007
December 31,
Pre-Medicare eligible claims . . . . . . . . . . . . . . . . . . . 8.8% down to 5.8% in 2018 and
gradually decreasing until 2079
reaching the ultimate rate of 4.1%
8.5% down to 5% in 2014 and
remaining constant thereafter
Medicare eligible claims . . . . . . . . . . . . . . . . . . . . . . 8.8% down to 5.8% in 2018 and
gradually decreasing until 2079
reaching the ultimate rate of 4.1%
10.5% down to 5% in 2018 and
remaining constant thereafter
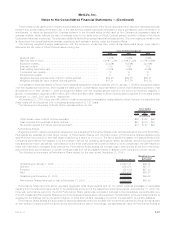
Assumed healthcare cost trend rates may have a significant effect on the amounts reported for healthcare plans. A one-percentage
point change in assumed healthcare cost trend rates would have the following effects:
One Percent
Increase One Percent
Decrease
(In millions)
Effectontotalofserviceandinterestcostcomponents.............................. $ 6 $ (6)
Effectofaccumulatedpostretirementbenefitobligation .............................. $76 $(86)
Plan Assets
The Subsidiaries have issued group annuity and life insurance contracts supporting approximately 99% of all pension and other
postretirement benefit plans assets.
The account values of the group annuity and life insurance contracts issued by the Subsidiaries and held as assets of the pension and
other postretirement benefit plans were $6,451 million and $7,565 million at December 31, 2008 and 2007, respectively. The majority of
such account values are held in separate accounts established by the Subsidiaries. Total revenue from these contracts recognized in the
consolidated statements of income was $42 million, $47 million and $48 million for the years ended December 31, 2008, 2007 and 2006,
respectively, and includes policy charges, net investment income from investments backing the contracts and administrative fees. Total
investment income (loss), including realized and unrealized gains and losses, credited to the account balances were ($1,090) million,
$603 million and $818 million for the years ended December 31, 2008, 2007 and 2006, respectively. The terms of these contracts are
consistent in all material respects with those the Subsidiaries offer to unaffiliated parties that are similarly situated.
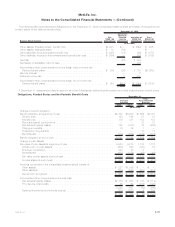
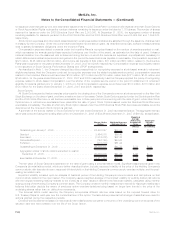
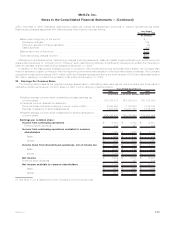
The weighted-average allocations of pension plan and other postretirement benefit plan assets were as follows:
2008 2007 2008 2007
Pension
Benefits
Other
Postretirement
Benefits
December 31,
Asset Category
Equitysecurities................................................... 28% 38% 27% 37%
Fixedmaturitysecurities.............................................. 51 44 71 58
Other(RealEstateandAlternativeInvestments)............................... 21 18 2 5
Total......................................................... 100% 100% 100% 100%
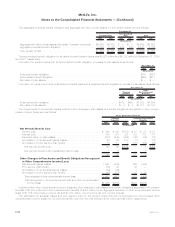
The weighted-average target allocations of pension plan and other postretirement benefit plan assets for 2009 are as follows:
Pension Other
Asset Category
Equitysecurities......................................................... 25%-45% 30%-45%
Fixedmaturitysecurities.................................................... 35%-55% 55%-85%
Other(RealEstateandAlternativeInvestments)..................................... 5%-32% 0%-10%
Target allocations of assets are determined with the objective of maximizing returns and minimizing volatility of net assets through
adequate asset diversification. Adjustments are made to target allocations based on an assessment of the impact of economic factors and
market conditions.
Cash Flows
It is the Subsidiaries’ practice to make contributions to the qualified pension plans to comply with minimum funding requirements of
ERISA. In accordance with such practice, no contributions were required for the years ended December 31, 2008 or 2007. No
contributions will be required for 2009. The Subsidiaries made discretionary contributions of $300 million to the qualified pension plans
during the year ended December 31, 2008 and did not make discretionary contributions for the year ended December 31, 2007. The
Subsidiaries expect to make additional discretionary contributions of $150 million in 2009.
Benefit payments due under the non-qualified pension plans are funded from the Subsidiaries’ general assets as they become due
under the provision of the plans. These payments totaled $43 million and $48 million for the years ended December 31, 2008 and 2007,
respectively. These payments are expected to be at approximately the same level in 2009.
Other postretirement benefits represent a non-vested, non-guaranteed obligation of the Subsidiaries and current regulations do not
require specific funding levels for these benefits. While the Subsidiaries have partially funded such plans in advance, it has been the
F-82 MetLife, Inc.
MetLife, Inc.
Notes to the Consolidated Financial Statements — (Continued)