MetLife 2008 Annual Report Download - page 204
Download and view the complete annual report
Please find page 204 of the 2008 MetLife annual report below. You can navigate through the pages in the report by either clicking on the pages listed below, or by using the keyword search tool below to find specific information within the annual report.-
 1
1 -
2
-
3
-
4
-
5
-
6
-
7
-
8
-
9
-
10
-
11
-
12
-
13
-
14
-
15
-
16
-
17
-
18
-
19
-
20
-
21
-
22
-
23
-
24
-
25
-
26
-
27
-
28
-
29
-
30
-
31
-
32
-
33
-
34
-
35
-
36
-
37
-
38
-
39
-
40
-
41
-
42
-
43
-
44
-
45
-
46
-
47
-
48
-
49
-
50
-
51
-
52
-
53
-
54
-
55
-
56
-
57
-
58
-
59
-
60
-
61
-
62
-
63
-
64
-
65
-
66
-
67
-
68
-
69
-
70
-
71
-
72
-
73
-
74
-
75
-
76
-
77
-
78
-
79
-
80
-
81
-
82
-
83
-
84
-
85
-
86
-
87
-
88
-
89
-
90
-
91
-
92
-
93
-
94
-
95
-
96
-
97
-
98
-
99
-
100
-
101
-
102
-
103
-
104
-
105
-
106
-
107
-
108
-
109
-
110
-
111
-
112
-
113
-
114
-
115
-
116
-
117
-
118
-
119
-
120
-
121
-
122
-
123
-
124
-
125
-
126
-
127
-
128
-
129
-
130
-
131
-
132
-
133
-
134
-
135
-
136
-
137
-
138
-
139
-
140
-
141
-
142
-
143
-
144
-
145
-
146
-
147
-
148
-
149
-
150
-
151
-
152
-
153
-
154
-
155
-
156
-
157
-
158
-
159
-
160
-
161
-
162
-
163
-
164
-
165
-
166
-
167
-
168
-
169
-
170
-
171
-
172
-
173
-
174
-
175
-
176
-
177
-
178
-
179
-
180
-
181
-
182
-
183
-
184
-
185
-
186
-
187
-
188
-
189
-
190
-
191
-
192
-
193
-
 194
194 -
 195
195 -
 196
196 -
 197
197 -
 198
198 -
 199
199 -
 200
200 -
 201
201 -
 202
202 -
 203
203 -
 204
204 -
 205
205 -
 206
206 -
 207
207 -
 208
208 -
 209
209 -
 210
210 -
 211
211 -
 212
212 -
 213
213 -
 214
214 -
215
-
216
-
217
-
218
-
219
-
220
-
221
-
222
-
223
-
224
-
225
-
226
-
227
-
228
-
229
-
230
-
231
-
232
-
233
-
234
-
235
-
236
-
237
-
238
-
239
-
240
 |
 |

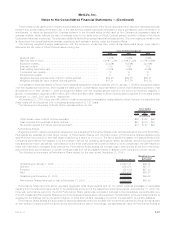
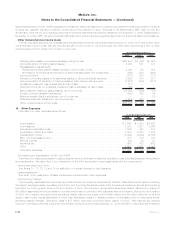
The estimated net actuarial losses and prior service credit for the defined benefit other postretirement benefit plans that will be
amortized from accumulated other comprehensive income (loss) into net periodic benefit cost over the next year are $10 million and
($36) million, respectively.
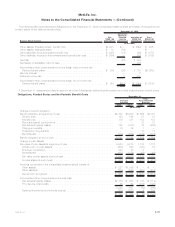
In 2004, the Company adopted the guidance in FSP No. 106-2, Accounting and Disclosure Requirements Related to the Medicare
Prescription Drug, Improvement and Modernization Act of 2003 (“FSP 106-2”), to account for future subsidies to be received under the
Prescription Drug Act. The Company began receiving these subsidies during 2006. A summary of the reduction to the APBO and related
reduction to the components of net periodic other postretirement benefit plan cost is as follows:
2008 2007 2006
December 31,
(In millions)
Cumulative reduction in benefit obligation:
Balance,beginningofyear ................................................. $299 $328 $298
Servicecost .......................................................... 5 7 6
Interestcost........................................................... 20 19 19
Netactuarialgains(losses)................................................. 3 (42) 15
Prescriptiondrugsubsidy.................................................. (10) (13) (10)
Balance,endofyear.................................................... $317 $299 $328
2008 2007 2006
Years Ended
December 31,
(In millions)
Reduction in net periodic benefit cost:
Servicecost............................................................. $ 5 $ 7 $ 6
Interestcost............................................................. 20 19 19
Amortizationofnetactuarialgains(losses) ......................................... — 5 30
Totalreductioninnetperiodicbenefitcost........................................ $25 $31 $55
The Company received subsidies of $12 million and $10 million for the years ended December 31, 2008 and 2007, respectively.
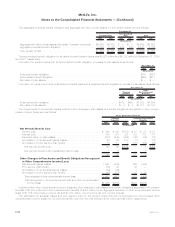
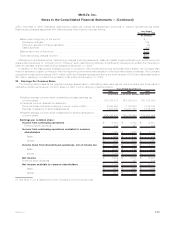
Assumptions
Assumptions used in determining benefit obligations were as follows:
2008 2007 2008 2007
Pension
Benefits
Other
Postretirement
Benefits
December 31,
Weightedaveragediscountrate.................................. 6.60% 6.65% 6.62% 6.65%
Rateofcompensationincrease .................................. 3.5%-7.5% 3.5%-8% N/A N/A
Assumptions used in determining net periodic benefit cost were as follows:
2008 2007 2006 2008 2007 2006
Pension Benefits Other Postretirement
Benefits
December 31,
Weighted average discount rate . . . . . . . . . . . . . . . . . . . . . . 6.65% 6.00% 5.82% 6.65% 6.00% 5.82%
Weighted average expected rate of return on plan assets . . . . . . 8.25% 8.25% 8.25% 7.33% 7.47% 7.42%
Rateofcompensationincrease ...................... 3.5%-8% 3.5%-8% 3%-8% N/A N/A N/A
The discount rate is determined annually based on the yield, measured on a yield to worst basis, of a hypothetical portfolio constructed
of high quality debt instruments available on the valuation date, which would provide the necessary future cash flows to pay the aggregate
projected benefit obligation when due.
Theexpectedrateofreturnonplanassetsisbasedonanticipatedperformanceofthevariousassetsectorsinwhichtheplaninvests,
weighted by target allocation percentages. Anticipated future performance is based on long-term historical returns of the plan assets by
sector, adjusted for the Subsidiaries’ long-term expectations on the performance of the markets. While the precise expected return derived
using this approach will fluctuate from year to year, the Subsidiaries’ policy is to hold this long-term assumption constant as long as it
remains within reasonable tolerance from the derived rate.
The weighted average expected return on plan assets for use in that plan’s valuation in 2009 is currently anticipated to be 8.25% for
pension benefits and postretirement medical benefits and 6.25% for postretirement life benefits.
F-81MetLife, Inc.
MetLife, Inc.
Notes to the Consolidated Financial Statements — (Continued)