MetLife 2008 Annual Report Download - page 156
Download and view the complete annual report
Please find page 156 of the 2008 MetLife annual report below. You can navigate through the pages in the report by either clicking on the pages listed below, or by using the keyword search tool below to find specific information within the annual report.-
 1
1 -
2
-
3
-
4
-
5
-
6
-
7
-
8
-
9
-
10
-
11
-
12
-
13
-
14
-
15
-
16
-
17
-
18
-
19
-
20
-
21
-
22
-
23
-
24
-
25
-
26
-
27
-
28
-
29
-
30
-
31
-
32
-
33
-
34
-
35
-
36
-
37
-
38
-
39
-
40
-
41
-
42
-
43
-
44
-
45
-
46
-
47
-
48
-
49
-
50
-
51
-
52
-
53
-
54
-
55
-
56
-
57
-
58
-
59
-
60
-
61
-
62
-
63
-
64
-
65
-
66
-
67
-
68
-
69
-
70
-
71
-
72
-
73
-
74
-
75
-
76
-
77
-
78
-
79
-
80
-
81
-
82
-
83
-
84
-
85
-
86
-
87
-
88
-
89
-
90
-
91
-
92
-
93
-
94
-
95
-
96
-
97
-
98
-
99
-
100
-
101
-
102
-
103
-
104
-
105
-
106
-
107
-
108
-
109
-
110
-
111
-
112
-
113
-
114
-
115
-
116
-
117
-
118
-
119
-
120
-
121
-
122
-
123
-
124
-
125
-
126
-
127
-
128
-
129
-
130
-
131
-
132
-
133
-
134
-
135
-
136
-
137
-
138
-
139
-
140
-
141
-
142
-
143
-
144
-
145
-
 146
146 -
 147
147 -
 148
148 -
 149
149 -
 150
150 -
 151
151 -
 152
152 -
 153
153 -
 154
154 -
 155
155 -
 156
156 -
 157
157 -
 158
158 -
 159
159 -
 160
160 -
 161
161 -
 162
162 -
 163
163 -
 164
164 -
 165
165 -
 166
166 -
167
-
168
-
169
-
170
-
171
-
172
-
173
-
174
-
175
-
176
-
177
-
178
-
179
-
180
-
181
-
182
-
183
-
184
-
185
-
186
-
187
-
188
-
189
-
190
-
191
-
192
-
193
-
194
-
195
-
196
-
197
-
198
-
199
-
200
-
201
-
202
-
203
-
204
-
205
-
206
-
207
-
208
-
209
-
210
-
211
-
212
-
213
-
214
-
215
-
216
-
217
-
218
-
219
-
220
-
221
-
222
-
223
-
224
-
225
-
226
-
227
-
228
-
229
-
230
-
231
-
232
-
233
-
234
-
235
-
236
-
237
-
238
-
239
-
240
 |
 |

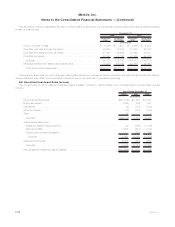
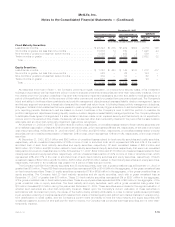
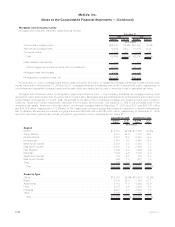
The changes in net unrealized investment gains (losses) are as follows:
2008 2007 2006
Years Ended December 31,
(In millions)
Balance,endofpriorperiod........................................ $ 971 $1,864 $1,942
Cumulative effect of change in accounting principles, net of income tax . . . . . . . . . . . (10) — —
Balance,beginningofperiod....................................... 961 1,864 1,942
Unrealizedinvestmentgains(losses)duringtheyear........................ (25,377) (2,140) (706)
Unrealizedinvestmentlossesofsubsidiariesatthedateofdisposal.............. 130 — —
Unrealized investment gains (losses) relating to:
Insuranceliabilitygain(loss)recognition .............................. 650 541 261
DACandVOBA .............................................. 3,370 (138) (110)
DACandVOBAofsubsidiariesatdateofdisposal........................ (18) — —
Policyholderdividendobligation.................................... 789 273 430
Deferredincometax ........................................... 6,991 571 47
Deferredincometaxofsubsidiariesatdateofdisposal..................... (60) — —
Balance, end of period . . . . . . . . . . . . . . . . . . . . . . . . . . . . . . . . . . . . . . . . . . . $(12,564) $ 971 $1,864
Change in net unrealized investment gains (losses) . . . . . . . . . . . . . . . . . . . . . . . . . $(13,525) $ (893) $ (78)
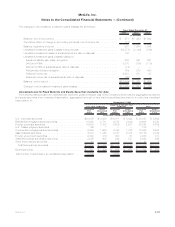
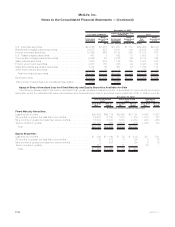
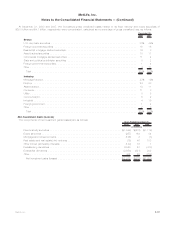
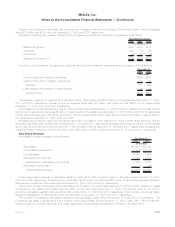
Unrealized Loss for Fixed Maturity and Equity Securities Available-for-Sale
The following tables present the estimated fair value and gross unrealized loss of the Company’s fixed maturity (aggregated by sector)
and equity securities in an unrealized loss position, aggregated by length of time that the securities have been in a continuous unrealized
loss position at:
Estimated
Fair
Value
Gross
Unrealized
Loss
Estimated
Fair
Value
Gross
Unrealized
Loss
Estimated
Fair
Value
Gross
Unrealized
Loss
Less than 12 Months Equal to or Greater than
12 Months Total
December 31, 2008
(In millions, except number of securities)
U.S.corporatesecurities......................... $30,076 $ 4,479 $18,011 $ 5,423 $ 48,087 $ 9,902
Residential mortgage-backed securities . . . . . . . . . . . . . . . . 10,032 2,711 4,572 2,009 14,604 4,720
Foreign corporate securities . . . . . . . . . . . . . . . . . . . . . . . 15,634 3,157 6,609 2,527 22,243 5,684
U.S.Treasury/agencysecurities..................... 106 1 — — 106 1
Commercial mortgage-backed securities . . . . . . . . . . . . . . . 9,259 1,665 3,093 1,788 12,352 3,453
Asset-backed securities . . . . . . . . . . . . . . . . . . . . . . . . . . 6,412 1,325 3,777 2,414 10,189 3,739
Foreigngovernmentsecurities...................... 2,030 316 403 61 2,433 377
State and political subdivision securities . . . . . . . . . . . . . . . 2,035 405 948 537 2,983 942
Otherfixedmaturitysecurities...................... 20 3 2 — 22 3
Total fixed maturity securities . . . . . . . . . . . . . . . . . . . . . $75,604 $14,062 $37,415 $14,759 $113,019 $28,821
Equitysecurities............................... $ 727 $ 306 $ 978 $ 672 $ 1,705 $ 978
Total number of securities in an unrealized loss position . . . . . 9,066 3,539
F-33MetLife, Inc.
MetLife, Inc.
Notes to the Consolidated Financial Statements — (Continued)