MetLife 2008 Annual Report Download - page 163
Download and view the complete annual report
Please find page 163 of the 2008 MetLife annual report below. You can navigate through the pages in the report by either clicking on the pages listed below, or by using the keyword search tool below to find specific information within the annual report.-
 1
1 -
2
-
3
-
4
-
5
-
6
-
7
-
8
-
9
-
10
-
11
-
12
-
13
-
14
-
15
-
16
-
17
-
18
-
19
-
20
-
21
-
22
-
23
-
24
-
25
-
26
-
27
-
28
-
29
-
30
-
31
-
32
-
33
-
34
-
35
-
36
-
37
-
38
-
39
-
40
-
41
-
42
-
43
-
44
-
45
-
46
-
47
-
48
-
49
-
50
-
51
-
52
-
53
-
54
-
55
-
56
-
57
-
58
-
59
-
60
-
61
-
62
-
63
-
64
-
65
-
66
-
67
-
68
-
69
-
70
-
71
-
72
-
73
-
74
-
75
-
76
-
77
-
78
-
79
-
80
-
81
-
82
-
83
-
84
-
85
-
86
-
87
-
88
-
89
-
90
-
91
-
92
-
93
-
94
-
95
-
96
-
97
-
98
-
99
-
100
-
101
-
102
-
103
-
104
-
105
-
106
-
107
-
108
-
109
-
110
-
111
-
112
-
113
-
114
-
115
-
116
-
117
-
118
-
119
-
120
-
121
-
122
-
123
-
124
-
125
-
126
-
127
-
128
-
129
-
130
-
131
-
132
-
133
-
134
-
135
-
136
-
137
-
138
-
139
-
140
-
141
-
142
-
143
-
144
-
145
-
146
-
147
-
148
-
149
-
150
-
151
-
152
-
 153
153 -
 154
154 -
 155
155 -
 156
156 -
 157
157 -
 158
158 -
 159
159 -
 160
160 -
 161
161 -
 162
162 -
 163
163 -
 164
164 -
 165
165 -
 166
166 -
 167
167 -
 168
168 -
 169
169 -
 170
170 -
 171
171 -
 172
172 -
 173
173 -
174
-
175
-
176
-
177
-
178
-
179
-
180
-
181
-
182
-
183
-
184
-
185
-
186
-
187
-
188
-
189
-
190
-
191
-
192
-
193
-
194
-
195
-
196
-
197
-
198
-
199
-
200
-
201
-
202
-
203
-
204
-
205
-
206
-
207
-
208
-
209
-
210
-
211
-
212
-
213
-
214
-
215
-
216
-
217
-
218
-
219
-
220
-
221
-
222
-
223
-
224
-
225
-
226
-
227
-
228
-
229
-
230
-
231
-
232
-
233
-
234
-
235
-
236
-
237
-
238
-
239
-
240
 |
 |

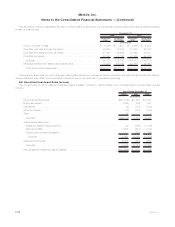
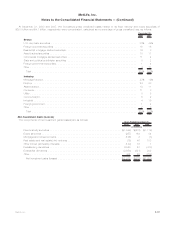
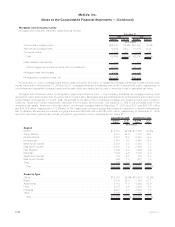
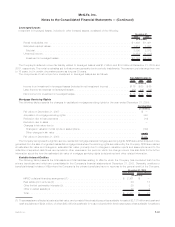
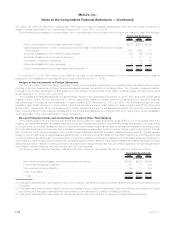
Mortgage and Consumer Loans
Mortgage and consumer loans are categorized as follows:
Amount Percent Amount Percent
2008 2007
December 31,
(In millions)
Commercialmortgageloans ................................. $36,197 72.9% $34,824 75.1%
Agriculturalmortgageloans.................................. 12,295 24.8 10,476 22.6
Consumerloans......................................... 1,164 2.3 1,046 2.3
Total . . . . . . . . . . . . . . . . . . . . . . . . . . . . . . . . . . . . . . . . . . . . . . . 49,656 100.0% 46,346 100.0%
Less:Valuationallowances.................................. 304 197
Totalmortgageandconsumerloansheld-for-investment.............. 49,352 46,149
Mortgageloansheld-for-sale................................. 2,012 5
Mortgageandconsumerloans,net............................. $51,364 $46,154
At December 31, 2008, mortgage loans held-for-sale include $1,975 million of residential mortgage loans held-for-sale carried under
the fair value option. At December 31, 2008 and 2007, mortgage loans held-for-sale also include $37 million and $5 million, respectively, of
commercial and residential mortgage loans held-for-sale which are carried at the lower of amortized cost or estimated fair value.
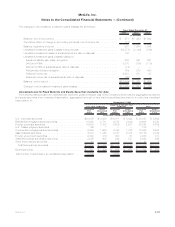
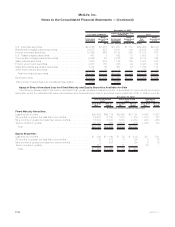
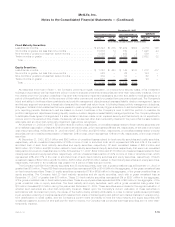
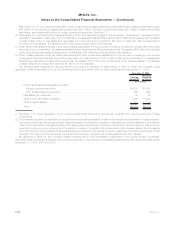
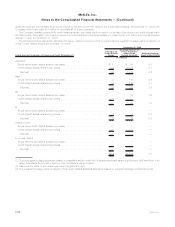
Mortgage and Consumer Loans by Geographic Region and Property Type — The Company diversifies its mortgage loans by both
geographic region and property type to reduce risk of concentration. Mortgage loans are collateralized by properties primarily located in the
United States. At December 31, 2008, 20%, 7% and 6% of the value of the Company’s mortgage and consumer loans were located in
California, Texas and Florida, respectively. Generally, the Company, as the lender, only loans up to 75% of the purchase price of the
underlying real estate. As shown in the table above, commercial mortgage loans at December 31, 2008 and 2007 were $36,197 million
and $34,824 million, respectively, or 72.9% and 75.1%, respectively, of total mortgage and consumer loans prior to valuation allowances.
Net of valuation allowances commercial mortgage loans were $35,965 million and $34,657 million, respectively, at December 31, 2008
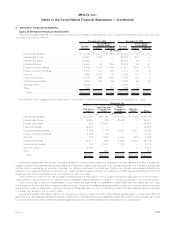
and 2007 and there was diversity across geographic regions and property types as shown below at:
Carrying
Value %of
Total Carrying
Value %of
Total
December 31, 2008 December 31, 2007
(In millions)
Region
Pacific ................................................ $ 8,837 24.6% $ 8,436 24.4%
SouthAtlantic............................................ 8,101 22.5 7,770 22.4
MiddleAtlantic ........................................... 5,931 16.5 5,042 14.5
International............................................. 3,414 9.5 3,642 10.5
WestSouthCentral........................................ 3,070 8.5 2,888 8.3
EastNorthCentral......................................... 2,591 7.2 2,866 8.3
NewEngland............................................ 1,529 4.3 1,464 4.2
Mountain............................................... 1,052 2.9 1,002 2.9
WestNorthCentral ........................................ 716 2.0 974 2.8
EastSouthCentral ........................................ 468 1.3 481 1.4
Other................................................. 256 0.7 92 0.3
Total . . . . . . . . . . . . . . . . . . . . . . . . . . . . . . . . . . . . . . . . . . . . . . . . $35,965 100.0% $34,657 100.0%
Property Type
Office................................................. $15,307 42.6% $15,216 43.9%
Retail................................................. 8,038 22.3 7,334 21.1
Apartments ............................................. 4,113 11.4 4,368 12.6
Hotel ................................................. 3,078 8.6 3,258 9.4
Industrial............................................... 2,901 8.1 2,622 7.6
Other................................................. 2,528 7.0 1,859 5.4
Total . . . . . . . . . . . . . . . . . . . . . . . . . . . . . . . . . . . . . . . . . . . . . . . . $35,965 100.0% $34,657 100.0%
F-40 MetLife, Inc.
MetLife, Inc.
Notes to the Consolidated Financial Statements — (Continued)