MetLife 2008 Annual Report Download - page 27
Download and view the complete annual report
Please find page 27 of the 2008 MetLife annual report below. You can navigate through the pages in the report by either clicking on the pages listed below, or by using the keyword search tool below to find specific information within the annual report.-
 1
1 -
2
-
3
-
4
-
5
-
6
-
7
-
8
-
9
-
10
-
11
-
12
-
13
-
14
-
15
-
16
-
 17
17 -
 18
18 -
 19
19 -
 20
20 -
 21
21 -
 22
22 -
 23
23 -
 24
24 -
 25
25 -
 26
26 -
 27
27 -
 28
28 -
 29
29 -
 30
30 -
 31
31 -
 32
32 -
 33
33 -
 34
34 -
 35
35 -
 36
36 -
 37
37 -
38
-
39
-
40
-
41
-
42
-
43
-
44
-
45
-
46
-
47
-
48
-
49
-
50
-
51
-
52
-
53
-
54
-
55
-
56
-
57
-
58
-
59
-
60
-
61
-
62
-
63
-
64
-
65
-
66
-
67
-
68
-
69
-
70
-
71
-
72
-
73
-
74
-
75
-
76
-
77
-
78
-
79
-
80
-
81
-
82
-
83
-
84
-
85
-
86
-
87
-
88
-
89
-
90
-
91
-
92
-
93
-
94
-
95
-
96
-
97
-
98
-
99
-
100
-
101
-
102
-
103
-
104
-
105
-
106
-
107
-
108
-
109
-
110
-
111
-
112
-
113
-
114
-
115
-
116
-
117
-
118
-
119
-
120
-
121
-
122
-
123
-
124
-
125
-
126
-
127
-
128
-
129
-
130
-
131
-
132
-
133
-
134
-
135
-
136
-
137
-
138
-
139
-
140
-
141
-
142
-
143
-
144
-
145
-
146
-
147
-
148
-
149
-
150
-
151
-
152
-
153
-
154
-
155
-
156
-
157
-
158
-
159
-
160
-
161
-
162
-
163
-
164
-
165
-
166
-
167
-
168
-
169
-
170
-
171
-
172
-
173
-
174
-
175
-
176
-
177
-
178
-
179
-
180
-
181
-
182
-
183
-
184
-
185
-
186
-
187
-
188
-
189
-
190
-
191
-
192
-
193
-
194
-
195
-
196
-
197
-
198
-
199
-
200
-
201
-
202
-
203
-
204
-
205
-
206
-
207
-
208
-
209
-
210
-
211
-
212
-
213
-
214
-
215
-
216
-
217
-
218
-
219
-
220
-
221
-
222
-
223
-
224
-
225
-
226
-
227
-
228
-
229
-
230
-
231
-
232
-
233
-
234
-
235
-
236
-
237
-
238
-
239
-
240
 |
 |

Year Ended December 31, 2007 compared with the Year Ended December 31, 2006 — The Company
Income from Continuing Operations
Income from continuing operations increased by $1,192 million, or 41%, to $4,102 million for the year ended December 31, 2007 from
$2,910 million for the comparable 2006 period.
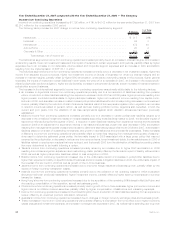
The following table provides the 2007 change in income from continuing operations by segment:
$ Change %ofTotal
$ Change
(In millions)
Institutional........................................................ $ 317 26%
Individual ......................................................... 99 8
International ....................................................... 472 40
Auto&Home ...................................................... 20 2
Corporate&Other ................................................... 284 24
Totalchange,netofincometax ...................................... $1,192 100%
The Institutional segment’s income from continuing operations increased primarily due to an increase in interest margins, an increase in
underwriting results, lower net investment losses and the impact of revisions to certain expenses in both periods, partially offset by higher
expenses due to an increase in non-deferrable volume-related and corporate support expenses and an increase in DAC amortization
resulting from the implementation of SOP 05-1 in 2007.
The Individual segment’s income from continuing operations increased primarily due to a decrease in net investment losses, higher fee
income from separate account products, higher net investment income on blocks of business not driven by interest margins and an
increase in interest margins, partially offset by higher DAC amortization, unfavorable underwriting results in life products, higher general
expenses, the impact of revisions to certain liabilities in both years, the write-off of a receivable in 2007, an increase in the closed block-
related policyholder dividend obligation, higher annuity benefits, increase in policyholder dividends, and an increase in interest credited to
policyholder account balances.
The increase in the International segment’s income from continuing operations was primarily attributable to the following factors:
• An increase in Argentina’s income from continuing operations primarily due to a net reduction of liabilities resulting from pension
reform, a reduction in claim liabilities resulting from experience reviews in both 2007 and 2006 years, higher premiums resulting from
higher pension contributions attributable to higher participant salaries, higher net investment income resulting from capital contri-
butions in 2006, and a smaller increase in market indexed policyholder liabilities without a corresponding decrease in net investment
income, partially offset by the reduction of cost of insurance fees as a result of the new pension system reform regulation, an increase
in retention incentives related to pension reform, as well as lower trading portfolio income. Argentina also benefited, in both the
current and prior years, from the utilization of tax loss carryforwards against which valuation allowances had been previously
established.
• Mexico’s income from continuing operations increased primarily due to a decrease in certain policyholder liabilities caused by a
decrease in the unrealized investment results on invested assets supporting those liabilities relative to 2006, the favorable impact of
experience refunds during the first quarter of 2007, a reduction in claim liabilities resulting from experience reviews and the adverse
impact in 2006 of an adjustment for experience refunds in its institutional business, a year over year decrease in DAC amortization
resulting from management’s update of assumptions used to determine estimated gross profits in both 2006 and 2007, a decrease in
liabilities based on a review of outstanding remittances, and growth in its institutional and universal life businesses. These increases
in Mexico’s income from continuing operations were partially offset by lower fees resulting from management’s update of assump-
tions used to determine estimated gross profits, the favorable impact in 2006 associated with a large group policy that was not
renewed by the policyholder, a decrease in various one-time revenue items, lower investment yields, the favorable impact in 2006 of
liabilities related to employment matters that were reduced, and the benefit 2006 from the elimination of liabilities for pending claims
that were determined to be invalid following a review.
• Taiwan’s income from continuing operations increased primarily driven by an increase due to higher DAC amortization in 2006
resulting from a loss recognition adjustment and restructuring costs, partially offset by the favorable impact of liability refinements in
2006, as well as higher policyholder liabilities related to loss recognition in 2006.
• Brazil’s income from continuing operations increased due to the unfavorable impact of increases in policyholder liabilities due to
higher than expected mortality on specific blocks of business and an increase in litigation liabilities in 2006, the unfavorable impact of
the reversal of a tax credit in 2006 as well as growth of the in-force business.
• Japan’s income from continuing operations increased due to improved hedge results and business growth, partially offset by the
impact of foreign currency transaction losses.
• Ireland’s income from continuing operations increased primarily due to the utilization of net operating losses for which a valuation
allowance had been previously established, higher investment income, partially offset by higher start-up expenses and currency
transaction losses.
• Hong Kong’s income from continuing operations increased due to the acquisition of the remaining 50% interest in MetLife Fubon and
the resulting consolidation of the operation, as well as business growth.
• Chile’s income from continuing operations increased primarily due to growth of the in-force business, higher joint venture income and
higher returns on inflation indexed securities, partially offset by higher compensation, infrastructure and marketing expenses.
• Income from continuing operations increased in the United Kingdom due to a reduction of claim liabilities resulting from an experience
review, offset by an unearned premium calculation refinement.
• Australia’s income from continuing operations increased due to changes in foreign currency exchange rates and business growth.
• These increases in income from continuing operations were partially offset by a decrease in the home office due to higher economic
capital charges and investment expenses, an increase in contingent tax expenses in 2007, as well as higher spending due to growth
24 MetLife, Inc.