MetLife 2008 Annual Report Download - page 120
Download and view the complete annual report
Please find page 120 of the 2008 MetLife annual report below. You can navigate through the pages in the report by either clicking on the pages listed below, or by using the keyword search tool below to find specific information within the annual report.-
 1
1 -
2
-
3
-
4
-
5
-
6
-
7
-
8
-
9
-
10
-
11
-
12
-
13
-
14
-
15
-
16
-
17
-
18
-
19
-
20
-
21
-
22
-
23
-
24
-
25
-
26
-
27
-
28
-
29
-
30
-
31
-
32
-
33
-
34
-
35
-
36
-
37
-
38
-
39
-
40
-
41
-
42
-
43
-
44
-
45
-
46
-
47
-
48
-
49
-
50
-
51
-
52
-
53
-
54
-
55
-
56
-
57
-
58
-
59
-
60
-
61
-
62
-
63
-
64
-
65
-
66
-
67
-
68
-
69
-
70
-
71
-
72
-
73
-
74
-
75
-
76
-
77
-
78
-
79
-
80
-
81
-
82
-
83
-
84
-
85
-
86
-
87
-
88
-
89
-
90
-
91
-
92
-
93
-
94
-
95
-
96
-
97
-
98
-
99
-
100
-
101
-
102
-
103
-
104
-
105
-
106
-
107
-
108
-
109
-
 110
110 -
 111
111 -
 112
112 -
 113
113 -
 114
114 -
 115
115 -
 116
116 -
 117
117 -
 118
118 -
 119
119 -
 120
120 -
 121
121 -
 122
122 -
 123
123 -
 124
124 -
 125
125 -
 126
126 -
 127
127 -
 128
128 -
 129
129 -
 130
130 -
131
-
132
-
133
-
134
-
135
-
136
-
137
-
138
-
139
-
140
-
141
-
142
-
143
-
144
-
145
-
146
-
147
-
148
-
149
-
150
-
151
-
152
-
153
-
154
-
155
-
156
-
157
-
158
-
159
-
160
-
161
-
162
-
163
-
164
-
165
-
166
-
167
-
168
-
169
-
170
-
171
-
172
-
173
-
174
-
175
-
176
-
177
-
178
-
179
-
180
-
181
-
182
-
183
-
184
-
185
-
186
-
187
-
188
-
189
-
190
-
191
-
192
-
193
-
194
-
195
-
196
-
197
-
198
-
199
-
200
-
201
-
202
-
203
-
204
-
205
-
206
-
207
-
208
-
209
-
210
-
211
-
212
-
213
-
214
-
215
-
216
-
217
-
218
-
219
-
220
-
221
-
222
-
223
-
224
-
225
-
226
-
227
-
228
-
229
-
230
-
231
-
232
-
233
-
234
-
235
-
236
-
237
-
238
-
239
-
240
 |
 |

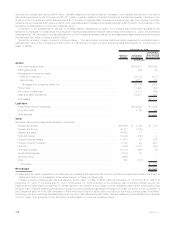
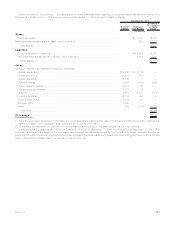
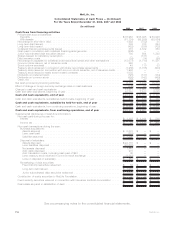
Sensitivity Analysis; Equity Prices. The table below provides additional detail regarding the potential loss in estimated fair value of the
Company’s portfolio due to a 10% change in equity at December 31, 2008 by type of asset or liability:
Notional
Amount Estimated
Fair Value(1)
Assuming a
10% Increase
in Equity
Prices
December 31, 2008
(In millions)
Assets
Equitysecurities ................................................... $ 3,197 $218
Netembeddedderivativeswithinassethostcontracts(2) .......................... 205 (15)
Totalassets..................................................... $203
Liabilities
Policyholderaccountbalances.......................................... $102,902 $121
Netembeddedderivativeswithinliabilityhostcontracts(2)........................ 3,051 240
Totalliabilities.................................................... $361
Other
Derivative instruments (designated hedges or otherwise)
Interestrateswaps.................................................. $34,060 $ 3,149 —
Interestratefloors .................................................. 48,517 1,748 —
Interestratecaps................................................... 24,643 11 —
Financialfutures ................................................... 19,908 (160) (626)
Foreigncurrencyswaps .............................................. 19,438 87 —
Foreigncurrencyforwards............................................. 5,167 24 —
Options......................................................... 8,450 3,127 (137)
Financialforwards .................................................. 28,176 296 3
Creditdefaultswaps................................................. 5,219 83 —
SyntheticGICs .................................................... 4,260 — —
Other .......................................................... 250 (101) 20
Totalother...................................................... $(740)
Net change ....................................................... $(176)
(1) Estimated fair value presented in the table above represents the estimated fair value of all financial instruments within this financial
statement caption not necessarily those solely subject to equity price risk.
(2) Embedded derivatives are recognized in the consolidated balance sheet in the same caption as the host contract.
Equity price risk increased by $80 million, or 83%, to $176 million at December 31, 2008 from $96 million at December 31, 2007. The
increase was primarily attributed to the increased use of equity derivatives employed by the Company to hedge its equity exposures,
particularly the use of financial futures and options. An increase in liabilities, particularly variable annuities with guaranteed minimum benefit
riders, during 2008 partially offset the increase in equity price risk.
117MetLife, Inc.