MetLife 2008 Annual Report Download - page 89
Download and view the complete annual report
Please find page 89 of the 2008 MetLife annual report below. You can navigate through the pages in the report by either clicking on the pages listed below, or by using the keyword search tool below to find specific information within the annual report.-
 1
1 -
2
-
3
-
4
-
5
-
6
-
7
-
8
-
9
-
10
-
11
-
12
-
13
-
14
-
15
-
16
-
17
-
18
-
19
-
20
-
21
-
22
-
23
-
24
-
25
-
26
-
27
-
28
-
29
-
30
-
31
-
32
-
33
-
34
-
35
-
36
-
37
-
38
-
39
-
40
-
41
-
42
-
43
-
44
-
45
-
46
-
47
-
48
-
49
-
50
-
51
-
52
-
53
-
54
-
55
-
56
-
57
-
58
-
59
-
60
-
61
-
62
-
63
-
64
-
65
-
66
-
67
-
68
-
69
-
70
-
71
-
72
-
73
-
74
-
75
-
76
-
77
-
78
-
 79
79 -
 80
80 -
 81
81 -
 82
82 -
 83
83 -
 84
84 -
 85
85 -
 86
86 -
 87
87 -
 88
88 -
 89
89 -
 90
90 -
 91
91 -
 92
92 -
 93
93 -
 94
94 -
 95
95 -
 96
96 -
 97
97 -
 98
98 -
 99
99 -
100
-
101
-
102
-
103
-
104
-
105
-
106
-
107
-
108
-
109
-
110
-
111
-
112
-
113
-
114
-
115
-
116
-
117
-
118
-
119
-
120
-
121
-
122
-
123
-
124
-
125
-
126
-
127
-
128
-
129
-
130
-
131
-
132
-
133
-
134
-
135
-
136
-
137
-
138
-
139
-
140
-
141
-
142
-
143
-
144
-
145
-
146
-
147
-
148
-
149
-
150
-
151
-
152
-
153
-
154
-
155
-
156
-
157
-
158
-
159
-
160
-
161
-
162
-
163
-
164
-
165
-
166
-
167
-
168
-
169
-
170
-
171
-
172
-
173
-
174
-
175
-
176
-
177
-
178
-
179
-
180
-
181
-
182
-
183
-
184
-
185
-
186
-
187
-
188
-
189
-
190
-
191
-
192
-
193
-
194
-
195
-
196
-
197
-
198
-
199
-
200
-
201
-
202
-
203
-
204
-
205
-
206
-
207
-
208
-
209
-
210
-
211
-
212
-
213
-
214
-
215
-
216
-
217
-
218
-
219
-
220
-
221
-
222
-
223
-
224
-
225
-
226
-
227
-
228
-
229
-
230
-
231
-
232
-
233
-
234
-
235
-
236
-
237
-
238
-
239
-
240
 |
 |

value, which reflect our estimates of liquidity and non performance risks, compared with pricing received from the independent pricing
services, did not produce material differences for the vast majority of our fixed maturity securities portfolio. Our estimates of liquidity and
non performance risks are generally based on available market evidence and on what other market participants would use. In absence of
such evidence, management’s best estimate is used. As a result, we generally continued to use the price provided by the independent
pricing service under our normal pricing protocol and pricing overrides were not material. As discussed in the “— Fair Value Hierarchy”
below, during 2008 due to these conditions, we have experienced an increase in Level 3 securities holdings which include less liquid fixed
maturity and equity securities, some with very limited trading activity. Even some of our very high quality invested assets have been more
illiquid for periods of time as a result of the challenging market conditions. The Company uses the results of this analysis for classifying the
estimated fair value of these instruments in Level 1, 2 or 3. For example, management will review the estimated fair values received to
determine whether corroborating evidence (i.e., similar observable positions and actual trades) will support a Level 2 classification in the
estimated fair value hierarchy. Security prices which cannot be corroborated due to relatively less pricing transparency and diminished
liquidity will be classified as Level 3.
For privately placed fixed maturity securities, the Company determines the estimated fair value generally through matrix pricing or
discounted cash flow techniques. The discounted cash flow valuations rely upon the estimated future cash flows of the security, credit
spreads of comparable public securities, and secondary transactions, as well as taking account of, among other factors, the credit quality
of the issuer and the reduced liquidity associated with privately placed debt securities.
The Company has reviewed the significance and observability of inputs used in the valuation methodologies to determine the
appropriate SFAS 157 fair value hierarchy level for each of its securities. Based on the results of this review and investment class
analyses, each instrument is categorized as Level 1, 2, or 3 based on the priority of the inputs to the respective valuation methodologies.
While prices for certain U.S. Treasury and agency fixed maturity securities, certain foreign government fixed maturity securities, exchange-
traded common stock, and certain short-term money market securities have been classified into Level 1 because of high volumes of
trading activity and narrow bid/ask spreads, most securities valued by independent pricing services have been classified into Level 2
because the significant inputs used in pricing these securities are market observable or can be corroborated using market observable
information. Most investment grade privately placed fixed maturity securities have been classified within Level 2, while most below
investment grade or distressed privately placed fixed maturity securities have been classified within Level 3. Where estimated fair values
are determined by independent pricing sources or by independent non-binding broker quotations that utilize inputs that are not market
observable or cannot be derived principally from or corroborated by observable market data, these instruments have been classified as
Level 3. Use of independent non-binding broker quotations generally indicates there is a lack of liquidity or the general lack of transparency
in the process to develop these price estimates causing them to be considered Level 3.
Ratings. The Securities Valuation Office of the NAIC evaluates the fixed maturity investments of insurers for regulatory reporting
purposes and assigns securities to one of six investment categories called “NAIC designations.” The NAIC ratings are similar to the rating
agency designations of the Nationally Recognized Statistical Rating Organizations (“NRSROs”) for marketable bonds. NAIC ratings 1 and 2
include bonds generally considered investment grade (rated “Baa3” or higher by Moody’s or rated “BBB — ” or higher by S&P and Fitch), by
such rating organizations. NAIC ratings 3 through 6 include bonds generally considered below investment grade (rated “Ba1” or lower by
Moody’s, or rated “BB+” or lower by S&P and Fitch).
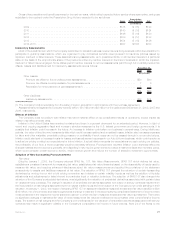
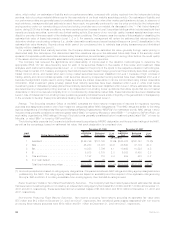
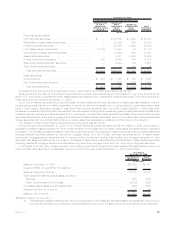
The following table presents the Company’s total fixed maturity securities by NRSRO designation and the equivalent ratings of the NAIC,
as well as the percentage, based on estimated fair value, that each designation is comprised of at:
NAIC
Rating Rating Agency Designation(1)
Cost or
Amortized
Cost Estimated
Fair Value %of
Total
Cost or
Amortized
Cost Estimated
Fair Value %of
Total
December 31, 2008 December 31, 2007
(In millions)
1 Aaa/Aa/A . . . . . . . . . . . . . . . . . . . . . . $146,796 $137,125 72.9% $165,328 $167,761 72.2%
2 Baa . . . . . . . . . . . . . . . . . . . . . . . . . . 45,253 38,761 20.6 46,520 47,172 20.3
3 Ba . . . . . . . . . . . . . . . . . . . . . . . . . . . 10,258 7,796 4.1 10,463 10,528 4.5
4 B ........................... 5,915 3,779 2.0 6,583 6,435 2.8
5 Caaandlower................... 1,192 715 0.4 459 428 0.2
6 Inorneardefault ................. 94 75 — 1 12 —
Total fixed maturity securities . . . . . . . . . $209,508 $188,251 100.0% $229,354 $232,336 100.0%
(1) Amounts presented are based on rating agency designations. Comparisons between NAIC ratings and rating agency designations are
published by the NAIC. The rating agency designations are based on availability and the midpoint of the applicable ratings among
Moody’s, S&P and Fitch. If no rating is available from a rating agency, then the MetLife rating is used.
Below Investment Grade or Non-Rated Fixed Maturity Securities. The Company held fixed maturity securities at estimated fair values
that were below investment grade or not rated by an independent rating agency that totaled $12.4 billion and $17.4 billion at December 31,
2008 and 2007, respectively. These securities had net unrealized losses of $5,094 million and $103 million at December 31, 2008 and
2007, respectively.
Non-Income Producing Fixed Maturity Securities. Non-income producing fixed maturity securities at estimated fair value were
$75 million and $12 million at December 31, 2008 and 2007, respectively. Net unrealized gains (losses) associated with non-income
producing fixed maturity securities were ($19) million and $11 million at December 31, 2008 and 2007, respectively.
86 MetLife, Inc.