MetLife 2008 Annual Report Download - page 29
Download and view the complete annual report
Please find page 29 of the 2008 MetLife annual report below. You can navigate through the pages in the report by either clicking on the pages listed below, or by using the keyword search tool below to find specific information within the annual report.-
 1
1 -
2
-
3
-
4
-
5
-
6
-
7
-
8
-
9
-
10
-
11
-
12
-
13
-
14
-
15
-
16
-
17
-
18
-
 19
19 -
 20
20 -
 21
21 -
 22
22 -
 23
23 -
 24
24 -
 25
25 -
 26
26 -
 27
27 -
 28
28 -
 29
29 -
 30
30 -
 31
31 -
 32
32 -
 33
33 -
 34
34 -
 35
35 -
 36
36 -
 37
37 -
 38
38 -
 39
39 -
40
-
41
-
42
-
43
-
44
-
45
-
46
-
47
-
48
-
49
-
50
-
51
-
52
-
53
-
54
-
55
-
56
-
57
-
58
-
59
-
60
-
61
-
62
-
63
-
64
-
65
-
66
-
67
-
68
-
69
-
70
-
71
-
72
-
73
-
74
-
75
-
76
-
77
-
78
-
79
-
80
-
81
-
82
-
83
-
84
-
85
-
86
-
87
-
88
-
89
-
90
-
91
-
92
-
93
-
94
-
95
-
96
-
97
-
98
-
99
-
100
-
101
-
102
-
103
-
104
-
105
-
106
-
107
-
108
-
109
-
110
-
111
-
112
-
113
-
114
-
115
-
116
-
117
-
118
-
119
-
120
-
121
-
122
-
123
-
124
-
125
-
126
-
127
-
128
-
129
-
130
-
131
-
132
-
133
-
134
-
135
-
136
-
137
-
138
-
139
-
140
-
141
-
142
-
143
-
144
-
145
-
146
-
147
-
148
-
149
-
150
-
151
-
152
-
153
-
154
-
155
-
156
-
157
-
158
-
159
-
160
-
161
-
162
-
163
-
164
-
165
-
166
-
167
-
168
-
169
-
170
-
171
-
172
-
173
-
174
-
175
-
176
-
177
-
178
-
179
-
180
-
181
-
182
-
183
-
184
-
185
-
186
-
187
-
188
-
189
-
190
-
191
-
192
-
193
-
194
-
195
-
196
-
197
-
198
-
199
-
200
-
201
-
202
-
203
-
204
-
205
-
206
-
207
-
208
-
209
-
210
-
211
-
212
-
213
-
214
-
215
-
216
-
217
-
218
-
219
-
220
-
221
-
222
-
223
-
224
-
225
-
226
-
227
-
228
-
229
-
230
-
231
-
232
-
233
-
234
-
235
-
236
-
237
-
238
-
239
-
240
 |
 |

The growth in the Auto & Home segment was primarily due to an increase in premiums related to increased exposures, an increase from
various voluntary and involuntary programs, and an increase resulting from the change in estimate on auto rate refunds due to a regulatory
examination, as well as an increase in other revenues primarily due to slower than anticipated claim payments in 2006. These increases
were partially offset by a reduction in average earned premium per policy, and an increase in catastrophe reinsurance costs.
The increase in Corporate & Other was primarily related to the resolution of an indemnification claim associated with the 2000
acquisition of GALIC, partially offset by an adjustment of surrender values on COLI policies.
Net Investment Income
Net investment income increased by $1,816 million, or 11%, to $18,063 million for the year ended December 31, 2007 from
$16,247 million for the comparable 2006 period. Management attributes $1,078 million of this increase to growth in the average asset
baseand$738milliontoanincreaseinyields.Theincreaseinnetinvestmentincomefromgrowthintheaverageassetbasewasprimarily
within fixed maturity securities, mortgage loans, real estate joint ventures and other limited partnership interests. The increase in net
investment income attributable to higher yields was primarily due to higher returns on fixed maturity securities, other limited partnership
interests excluding hedge funds, equity securities and improved securities lending results, partially offset by lower returns on real estate
joint ventures, cash, cash equivalents and short-term investments, hedge funds and mortgage loans.
Interest Margin
Interest margin, which represents the difference between interest earned and interest credited to policyholder account balances
increased in the Institutional and Individual segments for the year ended December 31, 2007 as compared to 2006. Interest earned
approximates net investment income on investable assets attributed to the segment with minor adjustments related to the consolidation of
certain separate accounts and other minor non-policyholder elements. Interest credited is the amount attributed to insurance products,
recorded in policyholder benefits and claims, and the amount credited to policyholder account balances for investment-type products,
recorded in interest credited to policyholder account balances. Interest credited on insurance products reflects the 2007 impact of the
interest rate assumptions established at issuance or acquisition. Interest credited to policyholder account balances is subject to
contractual terms, including some minimum guarantees. This tends to move gradually over time to reflect market interest rate movements
and may reflect actions by management to respond to competitive pressures and, therefore, generally does not introduce volatility in
expense.
Net Investment Gains (Losses)
Net investment losses decreased by $804 million to a loss of $578 million for the year ended December 31, 2007 from a loss of
$1,382 million for the comparable 2006 period. The decrease in net investment losses was primarily due to a reduction of losses on fixed
maturity securities resulting principally from the 2006 portfolio repositioning in a rising interest rate environment, increased gains from
asset-based foreign currency transactions due to a decline in the U.S. dollar year over year against several major currencies and increased
gains on equity securities, partially offset by increased losses from the mark-to-market on derivatives and reduced gains on real estate and
real estate joint ventures.
Underwriting
Underwriting results are generally the difference between the portion of premium and fee income intended to cover mortality, morbidity
or other insurance costs, less claims incurred, and the change in insurance-related liabilities. Underwriting results are significantly
influenced by mortality, morbidity or other insurance-related experience trends, as well as the reinsurance activity related to certain blocks
of business. Consequently, results can fluctuate from year to year. Underwriting results, excluding catastrophes, in the Auto & Home
segment were favorable for the year ended December 31, 2007. Although lower than comparable period of 2006, as the combined ratio,
excluding catastrophes, increased to 86.3% from 82.8% for the year ended December 31, 2006. Underwriting results were favorable in the
non-medical health & other, group life and retirement & savings businesses in the Institutional segment. Underwriting results were
unfavorable in the life products in the Individual segment.
Other Expenses
Other expenses increased by $892 million, or 9%, to $10,429 million for the year ended December 31, 2007 from $9,537 million for the
comparable 2006 period.
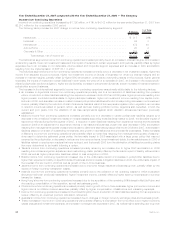
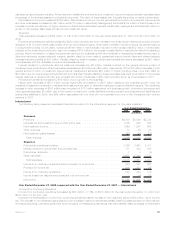
The following table provides the 2007 change in other expenses by segment:
$ Change %ofTotal
$ Change
(In millions)
Institutional........................................................ $126 14%
Individual ......................................................... 518 58
International ....................................................... 218 25
Auto&Home ...................................................... (17) (2)
Corporate&Other ................................................... 47 5
Totalchange .................................................. $892 100%
The Institutional segment contributed to the year over year increase primarily due to an increase in non-deferrable volume-related and
corporate support expenses, higher DAC amortization associated with the implementation of SOP 05-1 in 2007, a charge related to the
reimbursement of dental claims in 2007, the establishment of a contingent legal liability in 2007 and the impact of certain revisions in both
years. These increases were partially offset by a benefit related to a reduction of an allowance for doubtful accounts in 2007, the impact of
a charge for non-deferrable LTC commissions’ expense, a charge associated with costs related to the sale of certain small market record
keeping businesses and a charge associated with a regulatory settlement, all in 2006.
The Individual segment contributed to the year over year increase in other expenses primarily due to higher DAC amortization, higher
expenses associated with business growth, information technology and other general expenses, the impact of revisions to certain
liabilities, including pension and postretirement liabilities and policyholder liabilities in 2006, and a write-off of a receivable from one of the
Company’s joint venture partners in 2007.
26 MetLife, Inc.