MetLife 2008 Annual Report Download - page 39
Download and view the complete annual report
Please find page 39 of the 2008 MetLife annual report below. You can navigate through the pages in the report by either clicking on the pages listed below, or by using the keyword search tool below to find specific information within the annual report.-
 1
1 -
2
-
3
-
4
-
5
-
6
-
7
-
8
-
9
-
10
-
11
-
12
-
13
-
14
-
15
-
16
-
17
-
18
-
19
-
20
-
21
-
22
-
23
-
24
-
25
-
26
-
27
-
28
-
 29
29 -
 30
30 -
 31
31 -
 32
32 -
 33
33 -
 34
34 -
 35
35 -
 36
36 -
 37
37 -
 38
38 -
 39
39 -
 40
40 -
 41
41 -
 42
42 -
 43
43 -
 44
44 -
 45
45 -
 46
46 -
 47
47 -
 48
48 -
 49
49 -
50
-
51
-
52
-
53
-
54
-
55
-
56
-
57
-
58
-
59
-
60
-
61
-
62
-
63
-
64
-
65
-
66
-
67
-
68
-
69
-
70
-
71
-
72
-
73
-
74
-
75
-
76
-
77
-
78
-
79
-
80
-
81
-
82
-
83
-
84
-
85
-
86
-
87
-
88
-
89
-
90
-
91
-
92
-
93
-
94
-
95
-
96
-
97
-
98
-
99
-
100
-
101
-
102
-
103
-
104
-
105
-
106
-
107
-
108
-
109
-
110
-
111
-
112
-
113
-
114
-
115
-
116
-
117
-
118
-
119
-
120
-
121
-
122
-
123
-
124
-
125
-
126
-
127
-
128
-
129
-
130
-
131
-
132
-
133
-
134
-
135
-
136
-
137
-
138
-
139
-
140
-
141
-
142
-
143
-
144
-
145
-
146
-
147
-
148
-
149
-
150
-
151
-
152
-
153
-
154
-
155
-
156
-
157
-
158
-
159
-
160
-
161
-
162
-
163
-
164
-
165
-
166
-
167
-
168
-
169
-
170
-
171
-
172
-
173
-
174
-
175
-
176
-
177
-
178
-
179
-
180
-
181
-
182
-
183
-
184
-
185
-
186
-
187
-
188
-
189
-
190
-
191
-
192
-
193
-
194
-
195
-
196
-
197
-
198
-
199
-
200
-
201
-
202
-
203
-
204
-
205
-
206
-
207
-
208
-
209
-
210
-
211
-
212
-
213
-
214
-
215
-
216
-
217
-
218
-
219
-
220
-
221
-
222
-
223
-
224
-
225
-
226
-
227
-
228
-
229
-
230
-
231
-
232
-
233
-
234
-
235
-
236
-
237
-
238
-
239
-
240
 |
 |
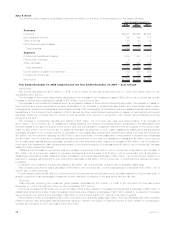
derivatives associated with assumed risk on variable annuity riders written directly through the Japan joint venture. Gains on freestanding
derivatives increased by $644 million, net of income tax, and were primarily driven by gains from equity options, financial futures, interest
rate swaps, and foreign currency forwards hedging the embedded derivatives. The gains on these equity options, financial futures, interest
rate swaps, and foreign currency forwards substantially offset the change in the underlying embedded derivative liability that is hedged by
these derivatives. Losses on the embedded derivatives increased by $532 million, net of income tax, and were driven by declining interest
rates, poor equity market performance, and foreign currency fluctuations throughout the year. These embedded derivative losses include a
$1,076 million, net of income tax, gain resulting from the effect of the widening of the Company’s own credit spread which is required to be
used in the valuation of these variable annuity rider embedded derivatives under SFAS 157, which became effective January 1, 2008. The
remaining change in net investment gains of $73 million, net of income tax, is principally attributable to an increase in impairments on fixed
maturity securities associated with financial services industry holdings which experienced losses as a result of bankruptcies, FDIC
receivership, and federal government assisted capital infusion transactions in the third and fourth quarters of 2008 as well as other credit
related impairments or losses on fixed maturity securities where the Company did not intend to hold the securities until recovery in
conjunction with overall market declines occurring throughout the year.
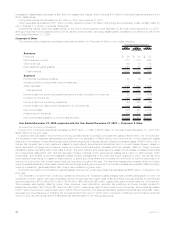
Excluding the impact of net investment gains (losses) of $39 million, net of income tax, and the adverse impact of changes in foreign
exchange rates of $13 million, net of income tax, income from continuing operations decreased by $90 million from the prior year.
Income from continuing operations decreased in:
• Argentina by $65 million, net of income tax primarily due to the negative impact the 2007 Argentine pension reform had on the 2008
income from continuing operations. These losses were partially offset by the net impact resulting from the Argentine nationalization of
the private pension system “Nationalization” as well as refinements to certain contingent and insurance liabilities associated with a
Supreme Court ruling. In 2007, pension reform legislation eliminated the obligation to provide death and disability coverage by the
plan administrators effective January 1, 2008 which created significant one time gains in the prior year resulting from the release of
death and disability reserves. In addition, the impact of the 2007 pension reform resulted in a decrease in premiums for the full year of
2008 partially offset by a decrease in claims and market-indexed policyholder liabilities. In December 2008, the Argentine govern-
ment nationalized the private pension system and seized the underlying investments. With this action the Company’s pension
business in Argentina ceased to exist. As a result, the Company eliminated certain assets which included deferred acquisition costs
and deferred tax assets, certain liabilities which included primarily the liability for future servicing obligations and incurred severance
costs associated with the termination of employees. The liability for future servicing obligations was established due to the 2007
pension reform which resulted in the Company managing significant pension assets for which the Company would no longer receive
any compensation. The elimination of this liability more than offset the elimination of assets and the incurred severance costs related
to the Nationalization. In addition to the impact of pension reform and Nationalization, Argentina’s income from continuing operations
was also favorably impacted by changes in contingent liabilities and the associated future policyholder benefits for Supreme Court
case decisions related to the pesification of insurance contracts by the government in 2002. Other developments include the
reduction of claim liabilities in the prior year from an experience review and the favorable impact in the current year of higher inflation
rates on indexed securities partially offset by higher losses on the trading securities portfolio. Argentina’s results were impacted, in
both the current and prior years, by valuation allowances against deferred taxes that are released only upon actual payment of taxes.
• Japan by $53 million, net of income tax, due to a decrease of $146 million, net of income tax, in the Company’s earnings from its
investment in Japan due to an increase in losses on embedded derivatives associated with variable annuity riders, an increase in DAC
amortization related to market performance and the impact of a refinement in assumptions for the guaranteed annuity business
partially offset by the favorable impact from the utilization of the fair value option for certain fixed annuities, as well as a decrease of
$14 million, net of income tax in earnings from assumed reinsurance, and an increase of $108 million, net of income tax, from
hedging activities associated with Japan’s guaranteed annuity benefits.
• The home office by $7 million, net of income tax, primarily due to higher economic capital charges and lower expenses in the prior
year resulting from the elimination of intercompany expenses previously charged to the International segment partially offset by a
decrease in accrued tax liabilities.
• Mexico by $4 million, net of income tax, primarily due to higher claims experience, an increase in certain policyholder liabilities
caused by lower unrealized investment losses on the invested assets supporting those liabilities relative to the prior year, the
favorable impact in the prior year of a decrease in experience refunds on Mexico’s institutional business, a lower increase in litigation
liabilities in the prior year, higher expenses related to business growth and infrastructure costs, as well as a valuation allowance
established against net operating losses, partially offset by the reinstatement of premiums from prior years, growth in the individual
and institutional businesses, higher net investment income due to an increase in invested assets as well as the impact of higher
inflation rates on indexed securities, lower DAC amortization resulting from management’s update of assumptions used to determine
estimated gross profits in both the current and prior years, and a decrease in liabilities based on a review of outstanding remittances.
• Chile by $3 million, net of income tax, primarily due to higher spending on growth initiatives, as well as higher commissions and
compensation expenses due to business growth partially offset by higher joint venture income.
Partially offsetting these decreases, income from continuing operations increased in:
• Hong Kong by $18 million, net of income tax, due to the acquisition of the remaining 50% interest in MetLife Fubon in the second
quarter of 2007 and the resulting consolidation of the operation beginning in the third quarter of 2007.
• Ireland by $5 million, net of income tax, due to foreign currency transaction losses in the prior year and foreign currency transaction
gains in the current year as well as higher net investment income due to an increase in invested assets, partially offset by higher
expenses related to growth initiatives and the utilization in the prior year of net operating losses for which a valuation allowance had
been previously established.
• Brazil by $4 million, net of income tax, primarily due to business growth offset by a decrease in claims liabilities in the prior year from
an experience review and higher claim experience in the current year.
• Taiwan by $4 million, net of income tax, primarily due to an increase in invested assets and a refinement in DAC capitalization as well
as business growth partially offset by the impact in both the current and prior years from refinements of methodologies related to the
estimation of profit emergence on certain blocks of business.
36 MetLife, Inc.