MetLife 2008 Annual Report Download - page 76
Download and view the complete annual report
Please find page 76 of the 2008 MetLife annual report below. You can navigate through the pages in the report by either clicking on the pages listed below, or by using the keyword search tool below to find specific information within the annual report.-
 1
1 -
2
-
3
-
4
-
5
-
6
-
7
-
8
-
9
-
10
-
11
-
12
-
13
-
14
-
15
-
16
-
17
-
18
-
19
-
20
-
21
-
22
-
23
-
24
-
25
-
26
-
27
-
28
-
29
-
30
-
31
-
32
-
33
-
34
-
35
-
36
-
37
-
38
-
39
-
40
-
41
-
42
-
43
-
44
-
45
-
46
-
47
-
48
-
49
-
50
-
51
-
52
-
53
-
54
-
55
-
56
-
57
-
58
-
59
-
60
-
61
-
62
-
63
-
64
-
65
-
 66
66 -
 67
67 -
 68
68 -
 69
69 -
 70
70 -
 71
71 -
 72
72 -
 73
73 -
 74
74 -
 75
75 -
 76
76 -
 77
77 -
 78
78 -
 79
79 -
 80
80 -
 81
81 -
 82
82 -
 83
83 -
 84
84 -
 85
85 -
 86
86 -
87
-
88
-
89
-
90
-
91
-
92
-
93
-
94
-
95
-
96
-
97
-
98
-
99
-
100
-
101
-
102
-
103
-
104
-
105
-
106
-
107
-
108
-
109
-
110
-
111
-
112
-
113
-
114
-
115
-
116
-
117
-
118
-
119
-
120
-
121
-
122
-
123
-
124
-
125
-
126
-
127
-
128
-
129
-
130
-
131
-
132
-
133
-
134
-
135
-
136
-
137
-
138
-
139
-
140
-
141
-
142
-
143
-
144
-
145
-
146
-
147
-
148
-
149
-
150
-
151
-
152
-
153
-
154
-
155
-
156
-
157
-
158
-
159
-
160
-
161
-
162
-
163
-
164
-
165
-
166
-
167
-
168
-
169
-
170
-
171
-
172
-
173
-
174
-
175
-
176
-
177
-
178
-
179
-
180
-
181
-
182
-
183
-
184
-
185
-
186
-
187
-
188
-
189
-
190
-
191
-
192
-
193
-
194
-
195
-
196
-
197
-
198
-
199
-
200
-
201
-
202
-
203
-
204
-
205
-
206
-
207
-
208
-
209
-
210
-
211
-
212
-
213
-
214
-
215
-
216
-
217
-
218
-
219
-
220
-
221
-
222
-
223
-
224
-
225
-
226
-
227
-
228
-
229
-
230
-
231
-
232
-
233
-
234
-
235
-
236
-
237
-
238
-
239
-
240
 |
 |

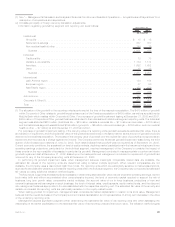
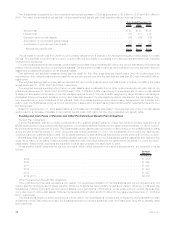
The assumed healthcare cost trend rates used in measuring the APBO and net periodic benefit cost were as follows:
2008 2007
December 31,
Pre-Medicare eligible claims . . . . . . . . . . . . . . . . 8.8% down to 5.8% in 2018 and 8.5% down to 5% in 2014 and
gradually decreasing until 2079 remaining constant thereafter
reaching the ultimate rate of 4.1%
Medicare eligible claims . . . . . . . . . . . . . . . . . . 8.8% down to 5.8% in 2018 and 10.5% down to 5% in 2018 and
gradually decreasing until 2079 remaining constant thereafter
reaching the ultimate rate of 4.1%
A recent review of the healthcare cost trend assumption indicated the need for a slight modification in this assumption as set forth in the
table above. This assumption change in our healthcare cost trend rate increased the APBO by $62 million. This rate is reviewed annually.
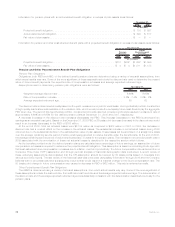
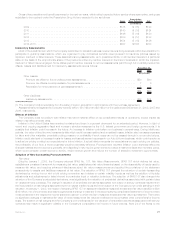
Assumed healthcare cost trend rates may have a significant effect on the amounts reported for healthcare plans. A one-percentage
point change in assumed healthcare cost trend rates would have the following effects: One Percent
Increase One Percent
Decrease
(In millions)
Effectontotalofserviceandinterestcostcomponents ......................... $ 6 $ (6)
Effectofaccumulatedpostretirementbenefitobligation.......................... $76 $(86)
A decrease (increase) in the discount rate increases (decreases) the APBO. This increase (decrease) to the APBO is amortized into
earnings as an actuarial loss (gain). Based on the December 31, 2008 APBO, a 25 basis point decrease (increase) in the discount rate
would result in an increase (decrease) in the APBO of $44 million.
At the end of 2008, total net actuarial losses were $147 million as compared to net actuarial gains of $112 million in 2007. In 2008, the
decrease in discount rate had a nominal effect on the increase in the actuarial losses. The increase in net actuarial losses during 2008
occurred due to the substantial decline in the estimated fair value of plan assets. These losses will be amortized on a straight-line basis
over the average remaining service period of active employees expected to receive benefits under the other postretirement benefit plans.
At the end of 2008, the average remaining service period of active employees was 7.9 years for the other postretirement benefit plans. The
increase in net periodic benefit cost in 2009 associated with the amortization of these net actuarial losses is described in the respective
section which follows.
In 2004, the Company adopted the guidance in Financial Accounting Standards Board (“FASB”) Staff Position (“FSP”) No. 106-2,
Accounting and Disclosure Requirements Related to the Medicare Prescription Drug, Improvement and Modernization Act of 2003
(“FSP 106-2”), to account for future subsidies to be received under the Prescription Drug Act. The Company began receiving these
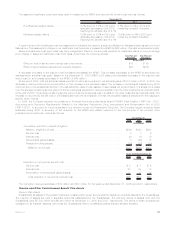
subsidies during 2006. A summary of the reduction to the APBO and related reduction to the components of net periodic other
postretirement benefit plan cost is as follows:
2008 2007 2006
December 31,
(In millions)
Cumulative reduction in benefit obligation:
Balance,beginningofyear.......................................... $299 $328 $298
Servicecost ................................................... 5 7 6
Interestcost ................................................... 20 19 19
Netactuarialgains(losses).......................................... 3 (42) 15
Prescriptiondrugsubsidy........................................... (10) (13) (10)
Balance,endofyear ............................................ $317 $299 $328
2008 2007 2006
Years Ended December 31,
(In millions)
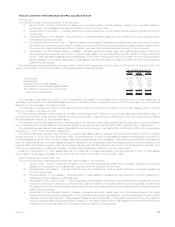
Reduction in net periodic benefit cost:
Servicecost .................................................... $ 5 $ 7 $ 6
Interestcost..................................................... 20 19 19
Amortizationofnetactuarialgains(losses) ................................. — 5 30
Totalreductioninnetperiodicbenefitcost................................ $25 $31 $55
The Company received subsidies of $12 million and $10 million for the years ended December 31, 2008 and 2007, respectively.
Pension and Other Postretirement Benefit Plan Assets
Pension Plan Assets
Substantially all assets of the pension plans are invested within group annuity and life insurance contracts issued by the Subsidiaries.
The majority of assets are held in separate accounts established by the Subsidiaries. The account values of assets held with the
Subsidiaries were $5,502 million and $6,440 million at December 31, 2008 and 2007, respectively. The terms of these contracts are
consistent in all material respects with those the Subsidiaries offer to unaffiliated parties that are similarly situated.
73MetLife, Inc.