MetLife 2008 Annual Report Download - page 9
Download and view the complete annual report
Please find page 9 of the 2008 MetLife annual report below. You can navigate through the pages in the report by either clicking on the pages listed below, or by using the keyword search tool below to find specific information within the annual report.-
 1
1 -
 2
2 -
 3
3 -
 4
4 -
 5
5 -
 6
6 -
 7
7 -
 8
8 -
 9
9 -
 10
10 -
 11
11 -
 12
12 -
 13
13 -
 14
14 -
 15
15 -
 16
16 -
 17
17 -
 18
18 -
 19
19 -
 20
20 -
21
-
22
-
23
-
24
-
25
-
26
-
27
-
28
-
29
-
30
-
31
-
32
-
33
-
34
-
35
-
36
-
37
-
38
-
39
-
40
-
41
-
42
-
43
-
44
-
45
-
46
-
47
-
48
-
49
-
50
-
51
-
52
-
53
-
54
-
55
-
56
-
57
-
58
-
59
-
60
-
61
-
62
-
63
-
64
-
65
-
66
-
67
-
68
-
69
-
70
-
71
-
72
-
73
-
74
-
75
-
76
-
77
-
78
-
79
-
80
-
81
-
82
-
83
-
84
-
85
-
86
-
87
-
88
-
89
-
90
-
91
-
92
-
93
-
94
-
95
-
96
-
97
-
98
-
99
-
100
-
101
-
102
-
103
-
104
-
105
-
106
-
107
-
108
-
109
-
110
-
111
-
112
-
113
-
114
-
115
-
116
-
117
-
118
-
119
-
120
-
121
-
122
-
123
-
124
-
125
-
126
-
127
-
128
-
129
-
130
-
131
-
132
-
133
-
134
-
135
-
136
-
137
-
138
-
139
-
140
-
141
-
142
-
143
-
144
-
145
-
146
-
147
-
148
-
149
-
150
-
151
-
152
-
153
-
154
-
155
-
156
-
157
-
158
-
159
-
160
-
161
-
162
-
163
-
164
-
165
-
166
-
167
-
168
-
169
-
170
-
171
-
172
-
173
-
174
-
175
-
176
-
177
-
178
-
179
-
180
-
181
-
182
-
183
-
184
-
185
-
186
-
187
-
188
-
189
-
190
-
191
-
192
-
193
-
194
-
195
-
196
-
197
-
198
-
199
-
200
-
201
-
202
-
203
-
204
-
205
-
206
-
207
-
208
-
209
-
210
-
211
-
212
-
213
-
214
-
215
-
216
-
217
-
218
-
219
-
220
-
221
-
222
-
223
-
224
-
225
-
226
-
227
-
228
-
229
-
230
-
231
-
232
-
233
-
234
-
235
-
236
-
237
-
238
-
239
-
240
 |
 |
America, Incorporated (“RGA”) and the elimination of the Reinsurance segment, MetLife is organized into four operating segments:
Institutional, Individual, Auto & Home and International, as well as Corporate & Other.
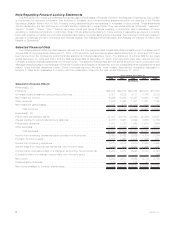
Year Ended December 31, 2008 compared with the Year Ended December 31, 2007
The Company reported $3,084 million in net income available to common shareholders and net income per diluted common share of
$4.14 for the year ended December 31, 2008 compared to $4,180 million in net income available to common shareholders and net income
per diluted common share of $5.48 for the year ended December 31, 2007. Net income available to common shareholders decreased by
$1,096 million, or 26%, for the year ended December 31, 2008 compared to the prior year.
The decrease in net income available to common shareholders was principally due to an increase in losses from discontinued
operations of $516 million. This was primarily the result of the split-off of substantially all of the Company’s interest in RGA in September
2008 whereby stockholders of the Company were offered the opportunity to exchange their shares of MetLife, Inc. common stock for
shares of RGA Class B common stock based upon a pre-determined exchange ratio.
The decrease in net income available to common shareholders was also driven by an increase in other expenses of $972 million, net of
income tax. The increase in other expenses was due to:
• Higher DAC amortization in the Individual segment related to lower expected future gross profits due to separate account balance
decreases resulting from recent market declines, higher net investment gains primarily due to net derivative gains and the reduction
on expected cumulative earnings of the closed block partially offset by a reduction in actual earnings of the closed block and
changes in assumptions used to estimate future gross profits and margins. In addition, there is further offset in the Institutional
segment due to a charge associated with the adoption of SOP 05-1 in the prior year.
• An increase in corporate expenses primarily related to an enterprise-wide cost reduction and revenue enhancement initiative. As a
result of a strategic review begun in 2007, the Company launched an enterprise initiative called Operational Excellence. This initiative
began in April 2008 and management expects the initiative to be fully implemented by December 31, 2010. This initiative is focused
on reducing complexity, leveraging scale, increasing productivity, improving the effectiveness of the Company’s operations and
providing a foundation for future growth. The Company recognized within Corporate & Other during the current period an initial
accrual for post-employment related expenses.
• Higher legal costs in Corporate & Other principally driven by costs associated with the commutation of three asbestos insurance
policies and higher expenses in the Institutional and International segments as well as Corporate & Other associated with business
growth and higher corporate support expenses.
• Higher expenses in Corporate & Other relating to increased compensation, rent, and mortgage loan origination costs and servicing
expenses associated with two acquisitions by MetLife Bank in 2008.
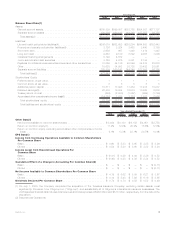
Premiums, fees and other revenues increased by $2,085 million, net of income tax, across all of the Company’s operating segments but
most notably within the Institutional and International segments due to business growth. Policyholder benefits and claims and policyholder
dividends increased commensurately by $2,393 million, net of income tax; however, policyholder benefits and claims were also adversely
impacted by an increase in catastrophe losses in the Auto & Home segment, a charge within the Institutional segment resulting from a
liability adjustment in the group annuity business, and business growth.
Net investment losses decreased by $1,554 million, net of income tax, to a gain of $1,178 million, net of income tax, for the year ended
December 31, 2008 from a loss of $376 million, net of income tax, for the comparable 2007 period. The decrease in net investment losses
is due to an increase in gains on derivatives partially offset by losses primarily on fixed maturity and equity securities. Derivative gains were
driven by gains on freestanding derivatives that were partially offset by losses on embedded derivatives primarily associated with variable
annuity riders. Gains on freestanding derivatives increased by $4,225 million, net of income tax, and were primarily driven by: i) gains on
certain interest rate swaps, floors and swaptions which were economic hedges of certain investment assets and liabilities, ii) gains from
foreign currency derivatives primarily due to the U.S. dollar strengthening as well as, iii) gains primarily from equity options, financial futures,
and interest rate swaps hedging the embedded derivatives. The gains on these equity options, financial futures, and interest rate swaps
substantially offset the change in the underlying embedded derivative liability that is hedged by these derivatives. Losses on the embedded
derivatives increased by $1,514 million, net of income tax, and were driven by declining interest rates and poor equity market performance
throughout the year. These embedded derivative losses include a $1,946 million, net of income tax, gain resulting from the effect of the
widening of the Company’s own credit spread which is required to be used in the valuation of these variable annuity rider embedded
derivatives under SFAS No. 157, Fair Value Measurements (“SFAS 157”), which became effective January 1, 2008. The remaining change
in net investment losses of $1,157 million, net of income tax, is principally attributable to an increase in losses on fixed maturity and equity
securities, and, to a lesser degree, an increase in losses on mortgage and consumer loans and other limited partnerships offset by an
increase in foreign currency transaction gains. The increase in losses on fixed maturity and equity securities is primarily attributable to an
increase in impairments associated with financial services industry holdings which experienced losses as a result of bankruptcies, FDIC
receivership, and Federal government assisted capital infusion transactions in the third and fourth quarters of 2008. Losses on fixed
maturity and equity securities were also driven by an increase in credit related impairments on communication and consumer sector
security holdings, losses on asset-backed securities as well as an increase in losses on fixed maturity security holdings where the
Company either lacked the intent to hold, or due to extensive credit widening, the Company was uncertain of its intent to hold these fixed
maturity securities for a period of time sufficient to allow recovery of the market value decline.
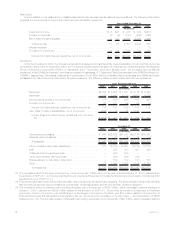
Net investment income decreased by $1,149 million, or 10%, net of income tax, to $10,592 million for the year ended December 31,
2008 from $11,741 million for the comparable 2007 period. Management attributes $2,042 million, net of income tax, of this change to a
decrease in yields, partially offset by an increase of $893 million due to growth in average invested assets. Average invested assets are
calculated on a cost basis without unrealized gains and losses. The decrease in net investment income attributable to lower yields was
primarily due to lower returns on other limited partnership interests, real estate joint ventures, short-term investments, fixed maturity
securities, and mortgage loans, partially offset by improved securities lending results. Management anticipates that the significant volatility
in the equity, real estate and credit markets will continue in 2009 which could continue to impact net investment income and yields on other
limited partnerships and real estate joint ventures. Net investment income increased due to an increase in average invested assets, on an
amortized cost basis, primarily within short-term investments, other invested assets including derivatives, mortgage loans, other limited
partnership interests, and real estate joint ventures.
6MetLife, Inc.