MetLife 2008 Annual Report Download - page 75
Download and view the complete annual report
Please find page 75 of the 2008 MetLife annual report below. You can navigate through the pages in the report by either clicking on the pages listed below, or by using the keyword search tool below to find specific information within the annual report.-
 1
1 -
2
-
3
-
4
-
5
-
6
-
7
-
8
-
9
-
10
-
11
-
12
-
13
-
14
-
15
-
16
-
17
-
18
-
19
-
20
-
21
-
22
-
23
-
24
-
25
-
26
-
27
-
28
-
29
-
30
-
31
-
32
-
33
-
34
-
35
-
36
-
37
-
38
-
39
-
40
-
41
-
42
-
43
-
44
-
45
-
46
-
47
-
48
-
49
-
50
-
51
-
52
-
53
-
54
-
55
-
56
-
57
-
58
-
59
-
60
-
61
-
62
-
63
-
64
-
 65
65 -
 66
66 -
 67
67 -
 68
68 -
 69
69 -
 70
70 -
 71
71 -
 72
72 -
 73
73 -
 74
74 -
 75
75 -
 76
76 -
 77
77 -
 78
78 -
 79
79 -
 80
80 -
 81
81 -
 82
82 -
 83
83 -
 84
84 -
 85
85 -
86
-
87
-
88
-
89
-
90
-
91
-
92
-
93
-
94
-
95
-
96
-
97
-
98
-
99
-
100
-
101
-
102
-
103
-
104
-
105
-
106
-
107
-
108
-
109
-
110
-
111
-
112
-
113
-
114
-
115
-
116
-
117
-
118
-
119
-
120
-
121
-
122
-
123
-
124
-
125
-
126
-
127
-
128
-
129
-
130
-
131
-
132
-
133
-
134
-
135
-
136
-
137
-
138
-
139
-
140
-
141
-
142
-
143
-
144
-
145
-
146
-
147
-
148
-
149
-
150
-
151
-
152
-
153
-
154
-
155
-
156
-
157
-
158
-
159
-
160
-
161
-
162
-
163
-
164
-
165
-
166
-
167
-
168
-
169
-
170
-
171
-
172
-
173
-
174
-
175
-
176
-
177
-
178
-
179
-
180
-
181
-
182
-
183
-
184
-
185
-
186
-
187
-
188
-
189
-
190
-
191
-
192
-
193
-
194
-
195
-
196
-
197
-
198
-
199
-
200
-
201
-
202
-
203
-
204
-
205
-
206
-
207
-
208
-
209
-
210
-
211
-
212
-
213
-
214
-
215
-
216
-
217
-
218
-
219
-
220
-
221
-
222
-
223
-
224
-
225
-
226
-
227
-
228
-
229
-
230
-
231
-
232
-
233
-
234
-
235
-
236
-
237
-
238
-
239
-
240
 |
 |

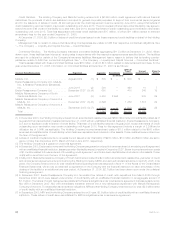
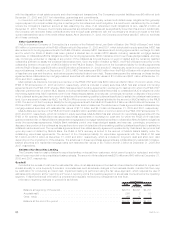
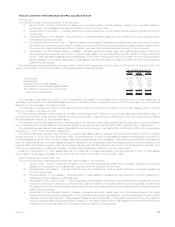
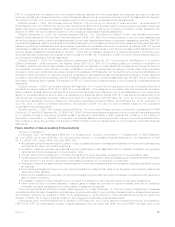
Information for pension plans with an accumulated benefit obligation in excess of plan assets is as follows:
2008 2007
December 31,
(In millions)
Projectedbenefitobligation................................................. $ 708 $ 597
Accumulatedbenefitobligation .............................................. $ 590 $ 517
Fairvalueofplanassets................................................... $ — $ —
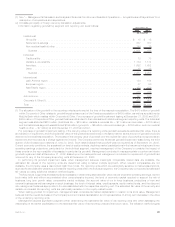
Information for pension and other postretirement benefit plans with a projected benefit obligation in excess of plan assets is as follows:
2008 2007 2008 2007
Pension
Benefits
Other
Postretirement
Benefits
December 31,
(In millions)
Projectedbenefitobligation...................................... $712 $602 $1,632 $1,599
Fairvalueofplanassets........................................ $ 4 $ 4 $1,011 $1,183
Pension and Other Postretirement Benefit Plan Obligations
Pension Plan Obligations
Obligations, both PBO and ABO, of the defined benefit pension plans are determined using a variety of actuarial assumptions, from
which actual results may vary. Some of the more significant of these assumptions include the discount rate used to determine the present
value of future benefit payments, the expected rate of compensation increases and average expected retirement age.
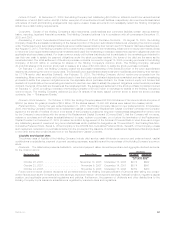
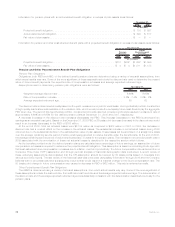
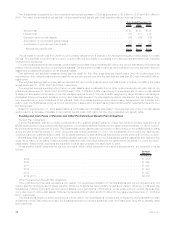
Assumptions used in determining pension plan obligations were as follows:
2008 2007
December 31,
Weightedaveragediscountrate........................................ 6.60% 6.65%
Rateofcompensationincrease ........................................ 3.5%-7.5% 3.5%-8%
Averageexpectedretirementage....................................... 63 63
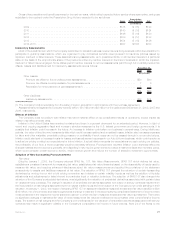
The discount rate is determined annually based on the yield, measured on a yield to worst basis, of a hypothetical portfolio constructed
of high-quality debt instruments available on the valuation date, which would provide the necessary future cash flows to pay the aggregate
PBO when due. The yield of this hypothetical portfolio, constructed of bonds rated AA or better by Moody’s resulted in a discount rate of
approximately 6.60% and 6.65% for the defined pension plans at December 31, 2008 and 2007, respectively.
A decrease (increase) in the discount rate increases (decreases) the PBO. This increase (decrease) to the PBO is amortized into
earnings as an actuarial loss (gain). Based on the December 31, 2008 PBO, a 25 basis point decrease (increase) in the discount rate would
result in an increase (decrease) in the PBO of $168 million.
At the end of 2008, total net actuarial losses were $2,184 million as compared to $623 million in 2007. In 2008, the decrease in
discount rate had a nominal effect on the increase in the actuarial losses. The substantial increase in net actuarial losses during 2008
occurred due to the substantial decline in the estimated fair value of plan assets. These losses will be amortized on a straight-line basis
over the average remaining service period of active employees expected to receive benefits under the benefit plans. At the end of 2008,
the average remaining service period of active employees was 7.9 years for the pension plans. The increase in net periodic benefit cost in
2009 associated with the amortization of these net actuarial losses is described in the respective section which follows.
As the benefits provided under the defined pension plans are calculated as a percentage of future earnings, an assumption of future
compensation increases is required to determine the projected benefit obligation. This assumption is based on a building block approach
that best-estimates future compensation increases due to inflation, merit and productivity. The future compensation rate is derived from a
Consumer Price Index (“CPI”) assumption and through periodic analysis of historical demographic data conducted. A recent review of
these underlying assumptions demonstrated that the CPI assumption should be lowered by 50 basis points based on forecasts from
various economic reports. The last review of the historical data was conducted using salary information through 2006 and the Company
believes that no circumstances have subsequently occurred that would result in a material change to the future compensation rate. The
50 basis point change in future compensation rate caused a decrease in PBO of $62 million. This rate is reviewed annually.
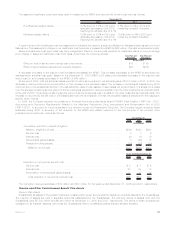
Other Postretirement Benefit Plan Obligations
The APBO is determined using a variety of actuarial assumptions, from which actual results may vary. Some of the more significant of
these assumptions include the discount rate, the healthcare cost trend rate and the average expected retirement age. The determination of
the discount rate and the average expected retirement age are substantially consistent with the determination described previously for the
pension plans.
72 MetLife, Inc.