MetLife 2008 Annual Report Download - page 118
Download and view the complete annual report
Please find page 118 of the 2008 MetLife annual report below. You can navigate through the pages in the report by either clicking on the pages listed below, or by using the keyword search tool below to find specific information within the annual report.-
 1
1 -
2
-
3
-
4
-
5
-
6
-
7
-
8
-
9
-
10
-
11
-
12
-
13
-
14
-
15
-
16
-
17
-
18
-
19
-
20
-
21
-
22
-
23
-
24
-
25
-
26
-
27
-
28
-
29
-
30
-
31
-
32
-
33
-
34
-
35
-
36
-
37
-
38
-
39
-
40
-
41
-
42
-
43
-
44
-
45
-
46
-
47
-
48
-
49
-
50
-
51
-
52
-
53
-
54
-
55
-
56
-
57
-
58
-
59
-
60
-
61
-
62
-
63
-
64
-
65
-
66
-
67
-
68
-
69
-
70
-
71
-
72
-
73
-
74
-
75
-
76
-
77
-
78
-
79
-
80
-
81
-
82
-
83
-
84
-
85
-
86
-
87
-
88
-
89
-
90
-
91
-
92
-
93
-
94
-
95
-
96
-
97
-
98
-
99
-
100
-
101
-
102
-
103
-
104
-
105
-
106
-
107
-
 108
108 -
 109
109 -
 110
110 -
 111
111 -
 112
112 -
 113
113 -
 114
114 -
 115
115 -
 116
116 -
 117
117 -
 118
118 -
 119
119 -
 120
120 -
 121
121 -
 122
122 -
 123
123 -
 124
124 -
 125
125 -
 126
126 -
 127
127 -
 128
128 -
129
-
130
-
131
-
132
-
133
-
134
-
135
-
136
-
137
-
138
-
139
-
140
-
141
-
142
-
143
-
144
-
145
-
146
-
147
-
148
-
149
-
150
-
151
-
152
-
153
-
154
-
155
-
156
-
157
-
158
-
159
-
160
-
161
-
162
-
163
-
164
-
165
-
166
-
167
-
168
-
169
-
170
-
171
-
172
-
173
-
174
-
175
-
176
-
177
-
178
-
179
-
180
-
181
-
182
-
183
-
184
-
185
-
186
-
187
-
188
-
189
-
190
-
191
-
192
-
193
-
194
-
195
-
196
-
197
-
198
-
199
-
200
-
201
-
202
-
203
-
204
-
205
-
206
-
207
-
208
-
209
-
210
-
211
-
212
-
213
-
214
-
215
-
216
-
217
-
218
-
219
-
220
-
221
-
222
-
223
-
224
-
225
-
226
-
227
-
228
-
229
-
230
-
231
-
232
-
233
-
234
-
235
-
236
-
237
-
238
-
239
-
240
 |
 |

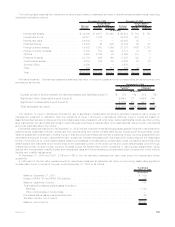
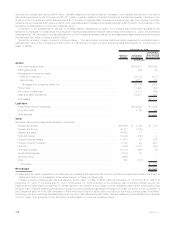
Sensitivity Analysis; Interest Rates. The table below provides additional detail regarding the potential loss in fair value of the
Company’s trading and non-trading interest sensitive financial instruments at December 31, 2008 by type of asset or liability:
Notional
Amount Estimated
Fair Value(3)
Assuming a
10% Increase
in the Yield
Curve
December 31, 2008
(In millions)
Assets
Fixedmaturitysecurities .............................................. $188,251 $(2,814)
Equitysecurities ................................................... 3,197 —
Tradingsecurities................................................... 946 (4)
Mortgage and consumer loans:
Held-for-investment................................................ 48,133 (155)
Held-for-sale .................................................... 2,010 (6)
Mortgageandconsumerloans,net .................................... 50,143 (161)
Policyloans ...................................................... 11,952 (146)
Realestatejointventures(1)............................................ 176 —
Otherlimitedpartnershipinterests(1) ...................................... 2,269 —
Short-terminvestments............................................... 13,878 (3)
Other invested assets:
Mortgageservicingrights ............................................ 191 (2)
Other......................................................... 900 (7)
Cashandcashequivalents ............................................ 24,207 —
Accruedinvestmentincome............................................ 3,061 —
Premiumsandotherreceivables ......................................... 3,473 (216)
Otherassets...................................................... 629 (49)
Assetsofsubsidiariesheld-for-sale ....................................... 649 (6)
Netembeddedderivativeswithinassethostcontracts(2) ......................... 205 (19)
Mortgageloancommitments ........................................... $ 2,690 (129) (6)
Commitments to fund bank credit facilities, bridge loans and private corporate bond
investments..................................................... 979 (105) —
Totalassets..................................................... $(3,433)
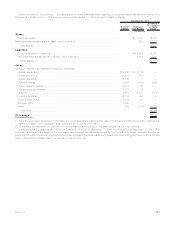
Liabilities
Policyholderaccountbalances.......................................... $102,902 $ 878
Short-termdebt.................................................... 2,659 —
Long-termdebt.................................................... 8,155 143
Collateralfinancingarrangements ........................................ 1,880 —
Juniorsubordinateddebtsecurities....................................... 2,606 30
Payablesforcollateralundersecuritiesloanedandothertransactions................. 31,059 —
Other liabilities:
Tradingliabilities.................................................. 57 —
Other......................................................... 638 —
Liabilitiesofsubsidiariesheld-for-sale...................................... 49 —
Netembeddedderivativeswithinliabilityhostcontracts(2) ........................ 3,051 216
Totalliabilities.................................................... $1,267
Other
Derivative instruments (designated hedges or otherwise)
Interestrateswaps.................................................. $34,060 $ 3,149 $ (550)
Interestratefloors .................................................. 48,517 1,748 (173)
Interestratecaps................................................... 24,643 11 4
Financialfutures ................................................... 19,908 (160) (1,565)
Foreigncurrencyswaps .............................................. 19,438 87 (46)
Foreigncurrencyforwards............................................. 5,167 24 1
Options......................................................... 8,450 3,127 (199)
Financialforwards .................................................. 28,176 296 (5)
Creditdefaultswaps................................................. 5,219 83 —
SyntheticGICs .................................................... 4,260 — —
Other .......................................................... 250 (101) —
Totalother...................................................... $(2,533)
Net change ....................................................... $(4,699)
(1) Represents only those investments accounted for using the cost method.
(2) Embedded derivatives are recognized in the consolidated balance sheet in the same caption as the host contract.
(3) Separate account assets and liabilities which are interest rate sensitive are not included herein as any interest rate risk is borne by the
holder of the separate account.
This quantitative measure of risk has decreased by $489 million, or approximately 9%, to $4,699 million at December 31, 2008 from
$5,188 million at December 31, 2007. From December 31, 2007 to December 31, 2008 there was a decline in interest rates across both
the swaps and treasury curves which resulted in a decrease in the interest rate risk by $2,860 million. In addition, the interest rate risk
declined by $755 million due to a reduction in the asset base and by $414 million due to the completion of the Company’s split-off of its
52% ownership in RGA. A change in the method of estimating the fair value of liabilities in connection with the adoption of SFAS 157 further
115MetLife, Inc.