MetLife 2008 Annual Report Download - page 159
Download and view the complete annual report
Please find page 159 of the 2008 MetLife annual report below. You can navigate through the pages in the report by either clicking on the pages listed below, or by using the keyword search tool below to find specific information within the annual report.-
 1
1 -
2
-
3
-
4
-
5
-
6
-
7
-
8
-
9
-
10
-
11
-
12
-
13
-
14
-
15
-
16
-
17
-
18
-
19
-
20
-
21
-
22
-
23
-
24
-
25
-
26
-
27
-
28
-
29
-
30
-
31
-
32
-
33
-
34
-
35
-
36
-
37
-
38
-
39
-
40
-
41
-
42
-
43
-
44
-
45
-
46
-
47
-
48
-
49
-
50
-
51
-
52
-
53
-
54
-
55
-
56
-
57
-
58
-
59
-
60
-
61
-
62
-
63
-
64
-
65
-
66
-
67
-
68
-
69
-
70
-
71
-
72
-
73
-
74
-
75
-
76
-
77
-
78
-
79
-
80
-
81
-
82
-
83
-
84
-
85
-
86
-
87
-
88
-
89
-
90
-
91
-
92
-
93
-
94
-
95
-
96
-
97
-
98
-
99
-
100
-
101
-
102
-
103
-
104
-
105
-
106
-
107
-
108
-
109
-
110
-
111
-
112
-
113
-
114
-
115
-
116
-
117
-
118
-
119
-
120
-
121
-
122
-
123
-
124
-
125
-
126
-
127
-
128
-
129
-
130
-
131
-
132
-
133
-
134
-
135
-
136
-
137
-
138
-
139
-
140
-
141
-
142
-
143
-
144
-
145
-
146
-
147
-
148
-
 149
149 -
 150
150 -
 151
151 -
 152
152 -
 153
153 -
 154
154 -
 155
155 -
 156
156 -
 157
157 -
 158
158 -
 159
159 -
 160
160 -
 161
161 -
 162
162 -
 163
163 -
 164
164 -
 165
165 -
 166
166 -
 167
167 -
 168
168 -
 169
169 -
170
-
171
-
172
-
173
-
174
-
175
-
176
-
177
-
178
-
179
-
180
-
181
-
182
-
183
-
184
-
185
-
186
-
187
-
188
-
189
-
190
-
191
-
192
-
193
-
194
-
195
-
196
-
197
-
198
-
199
-
200
-
201
-
202
-
203
-
204
-
205
-
206
-
207
-
208
-
209
-
210
-
211
-
212
-
213
-
214
-
215
-
216
-
217
-
218
-
219
-
220
-
221
-
222
-
223
-
224
-
225
-
226
-
227
-
228
-
229
-
230
-
231
-
232
-
233
-
234
-
235
-
236
-
237
-
238
-
239
-
240
 |
 |
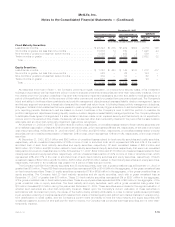
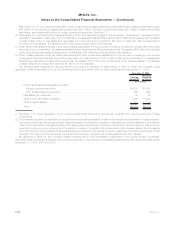
In the Company’s impairment review process, the duration of, and severity of, an unrealized loss position, such as unrealized losses of
20% or more for equity securities, which was $903 million and $133 million at December 31, 2008 and 2007, respectively, is given greater
weight and consideration, than for fixed maturity securities. An extended and severe unrealized loss position on a fixed maturity security
maynothaveanyimpactontheabilityoftheissuertoserviceallscheduled interest and principal payments and the Company’s evaluation
of recoverability of all contractual cash flows, as well as the Company’s ability and intent to hold the security, including holding the security
until the earlier of a recovery in value, or until maturity. In contrast, for an equity security, greater weight and consideration is given by the
Company to a decline in market value and the likelihood such market value decline will recover.
Equity securities with an unrealized loss of 20% or more for six months or greater was $384 million at December 31, 2008, of which
$382 million of the unrealized losses, or 99%, are for non-redeemable preferred securities, of which, $377 million of the unrealized losses,
or 99%, are for investment grade non-redeemable preferred securities. Of the $377 million of unrealized losses for investment grade non-
redeemable preferred securities, $372 million of the unrealized losses, or 99%, was comprised of unrealized losses on investment grade
financial services industry non-redeemable preferred securities, of which 85% are rated A or higher.
Equity securities with an unrealized loss of 20% or more for less than six months was $519 million at December 31, 2008 of which
$427 million of the unrealized losses, or 82%, are for non-redeemable preferred securities, of which $421 million, of the unrealized losses,
or 98% are for investment grade non-redeemable preferred securities. Of the $421 million of unrealized losses for investment grade non-
redeemable preferred securities, $417 million of the unrealized losses, or 99%, was comprised of unrealized losses on investment grade
financial services industry non-redeemable preferred securities, of which 81% are rated A or higher.
There were no equity securities with an unrealized loss of 20% or more for twelve months or greater.
In connection with the equity securities impairment review process during 2008, the Company evaluated its holdings in non-redeemable
preferred securities, particularly those of financial services industry companies. The Company considered several factors including
whether there has been any deterioration in credit of the issuer and the likelihood of recovery in value of non-redeemable preferred
securities with a severe or an extended unrealized loss. With respect to common stock holdings, the Company considered the duration
and severity of the securities in an unrealized loss position of 20% or more; and the duration of securities in an unrealized loss position of
20% or less with in an extended unrealized loss position (i.e., 12 months or more).
At December 31, 2008, there are $903 million of equity securities with an unrealized loss of 20% or more, of which $809 million of the
unrealized losses, or 90%, were for non-redeemable preferred securities. Through December 31, 2008, $798 million of the unrealized
losses of 20% or more, or 99%, of the non-redeemable preferred securities were investment grade securities, of which, $789 million of the
unrealized losses of 20% or more, or 99%, are investment grade financial services industry non-redeemable preferred securities; and all
non-redeemable preferred securities with unrealized losses of 20% or more, regardless of rating, have not deferred any dividend payments.
Also, the Company believes the unrealized loss position is not necessarily predictive of the ultimate performance of these securities,
and with respect to fixed maturity securities, it has the ability and intent to hold until the earlier of the recovery in value, or until maturity, and
with respect to equity securities, it has the ability and intent to hold until the recovery in value. Future other-than-temporary impairments will
depend primarily on economic fundamentals, issuer performance, changes in collateral valuation, changes in interest rates, and changes
in credit spreads. If economic fundamentals and other of the above factors continue to deteriorate, additional other-than-temporary
impairments may be incurred in upcoming quarters.
F-36 MetLife, Inc.
MetLife, Inc.
Notes to the Consolidated Financial Statements — (Continued)