MetLife 2008 Annual Report Download - page 105
Download and view the complete annual report
Please find page 105 of the 2008 MetLife annual report below. You can navigate through the pages in the report by either clicking on the pages listed below, or by using the keyword search tool below to find specific information within the annual report.-
 1
1 -
2
-
3
-
4
-
5
-
6
-
7
-
8
-
9
-
10
-
11
-
12
-
13
-
14
-
15
-
16
-
17
-
18
-
19
-
20
-
21
-
22
-
23
-
24
-
25
-
26
-
27
-
28
-
29
-
30
-
31
-
32
-
33
-
34
-
35
-
36
-
37
-
38
-
39
-
40
-
41
-
42
-
43
-
44
-
45
-
46
-
47
-
48
-
49
-
50
-
51
-
52
-
53
-
54
-
55
-
56
-
57
-
58
-
59
-
60
-
61
-
62
-
63
-
64
-
65
-
66
-
67
-
68
-
69
-
70
-
71
-
72
-
73
-
74
-
75
-
76
-
77
-
78
-
79
-
80
-
81
-
82
-
83
-
84
-
85
-
86
-
87
-
88
-
89
-
90
-
91
-
92
-
93
-
94
-
 95
95 -
 96
96 -
 97
97 -
 98
98 -
 99
99 -
 100
100 -
 101
101 -
 102
102 -
 103
103 -
 104
104 -
 105
105 -
 106
106 -
 107
107 -
 108
108 -
 109
109 -
 110
110 -
 111
111 -
 112
112 -
 113
113 -
 114
114 -
 115
115 -
116
-
117
-
118
-
119
-
120
-
121
-
122
-
123
-
124
-
125
-
126
-
127
-
128
-
129
-
130
-
131
-
132
-
133
-
134
-
135
-
136
-
137
-
138
-
139
-
140
-
141
-
142
-
143
-
144
-
145
-
146
-
147
-
148
-
149
-
150
-
151
-
152
-
153
-
154
-
155
-
156
-
157
-
158
-
159
-
160
-
161
-
162
-
163
-
164
-
165
-
166
-
167
-
168
-
169
-
170
-
171
-
172
-
173
-
174
-
175
-
176
-
177
-
178
-
179
-
180
-
181
-
182
-
183
-
184
-
185
-
186
-
187
-
188
-
189
-
190
-
191
-
192
-
193
-
194
-
195
-
196
-
197
-
198
-
199
-
200
-
201
-
202
-
203
-
204
-
205
-
206
-
207
-
208
-
209
-
210
-
211
-
212
-
213
-
214
-
215
-
216
-
217
-
218
-
219
-
220
-
221
-
222
-
223
-
224
-
225
-
226
-
227
-
228
-
229
-
230
-
231
-
232
-
233
-
234
-
235
-
236
-
237
-
238
-
239
-
240
 |
 |

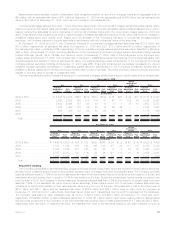
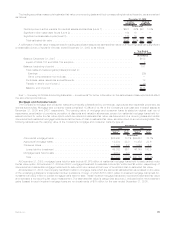
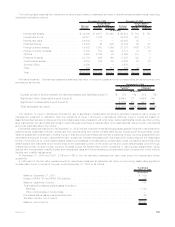
The following table presents the amortized cost and valuation allowances for consumer loans held-for-investment distributed by loan
classification at:
Amortized
Cost (1) %of
Total Valuation
Allowance
%of
Amortized
Cost Amortized
Cost (1) %of
Total Valuation
Allowance
%of
Amortized
Cost
December 31, 2008 December 31, 2007
(In millions)
Performing ....................... $1,116 95.8% $11 1.0% $1,001 95.7% $5 0.5%
Restructured...................... — — — —% — — — —%
Potentiallydelinquent ................ 17 1.5 — —% 19 1.8 — —%
Delinquent or under foreclosure . . . . . . . . . 31 2.7 — —% 26 2.5 1 4.0%
Total . . . . . . . . . . . . . . . . . . . . . . . . . . $1,164 100.0% $11 0.9% $1,046 100.0% $ 6 0.6%
(1) Amortized cost is equal to carrying value before valuation allowances.
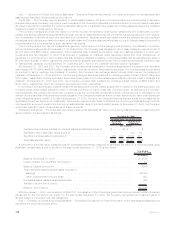
The following table presents the changes in valuation allowances for consumer loans held-for-investment for the:
2008 2007 2006
Years Ended December 31,
(In millions)
Balance,beginningofperiod.......................................... $ 6 $11 $14
Additions ...................................................... 6 — 1
Deductions ..................................................... (1) (5) (4)
Balance,endofperiod.............................................. $11 $ 6 $11
Real Estate Holdings
The Company’s real estate holdings consist of commercial properties located primarily in the United States. At December 31, 2008 and
2007, the carrying value of the Company’s real estate, real estate joint ventures and real estate held-for-sale was $7.6 billion and
$6.8 billion, respectively, or 2.4% and 2.1%, respectively, of total cash and invested assets. The carrying value of real estate is stated at
depreciated cost net of impairments and valuation allowances. The carrying value of real estate joint ventures is stated at the Company’s
equity in the real estate joint ventures net of impairments and valuation allowances.
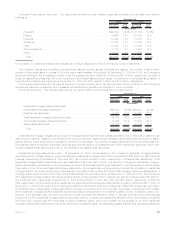
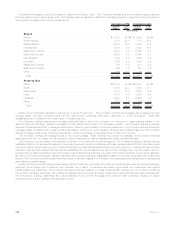
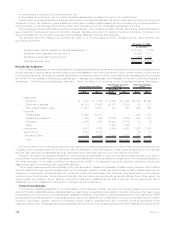
The following table presents the carrying value of the Company’s real estate holdings at:
Type Carrying
Value %of
Total Carrying
Value %of
Total
2008 2007
(In millions)
December 31,
Realestate............................................... $4,061 53.5% $3,954 58.4%
Realestatejointventures ..................................... 3,522 46.5 2,771 41.0
Foreclosedrealestate ....................................... 2 — 3 —
7,585 100.0 6,728 99.4
Realestateheld-for-sale...................................... 1 — 39 0.6
Total real estate holdings . . . . . . . . . . . . . . . . . . . . . . . . . . . . . . . . . . . . $7,586 100.0% $6,767 100.0%
The Company diversifies its real estate holdings by both geographic region and property type to reduce risk of concentration. The
Company’s real estate holdings are primarily located in the United States. At December 31, 2008, 22%, 13%, 11% and 8% of the
Company’s real estate holdings were located in California, Florida, New York and Texas, respectively. Property type diversification is shown
in the table below.
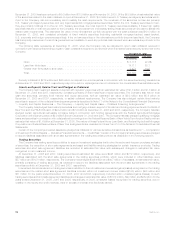
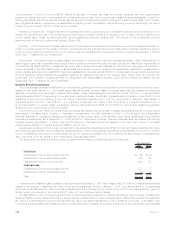
Real estate holdings were categorized as follows:
Amount Percent Amount Percent
2008 2007
December 31,
(In millions)
Office ................................................. $3,489 46% $3,480 51%
Apartments.............................................. 1,602 21 1,148 17
Realestateinvestmentfunds .................................. 1,080 14 950 14
Industrial ............................................... 483 7 443 7
Retail.................................................. 472 6 455 7
Hotel.................................................. 180 3 60 1
Land.................................................. 155 2 125 2
Agriculture .............................................. 24 — 29 —
Other.................................................. 101 1 77 1
Totalrealestateholdings.................................... $7,586 100% $6,767 100%
102 MetLife, Inc.