MetLife 2008 Annual Report Download - page 77
Download and view the complete annual report
Please find page 77 of the 2008 MetLife annual report below. You can navigate through the pages in the report by either clicking on the pages listed below, or by using the keyword search tool below to find specific information within the annual report.-
 1
1 -
2
-
3
-
4
-
5
-
6
-
7
-
8
-
9
-
10
-
11
-
12
-
13
-
14
-
15
-
16
-
17
-
18
-
19
-
20
-
21
-
22
-
23
-
24
-
25
-
26
-
27
-
28
-
29
-
30
-
31
-
32
-
33
-
34
-
35
-
36
-
37
-
38
-
39
-
40
-
41
-
42
-
43
-
44
-
45
-
46
-
47
-
48
-
49
-
50
-
51
-
52
-
53
-
54
-
55
-
56
-
57
-
58
-
59
-
60
-
61
-
62
-
63
-
64
-
65
-
66
-
 67
67 -
 68
68 -
 69
69 -
 70
70 -
 71
71 -
 72
72 -
 73
73 -
 74
74 -
 75
75 -
 76
76 -
 77
77 -
 78
78 -
 79
79 -
 80
80 -
 81
81 -
 82
82 -
 83
83 -
 84
84 -
 85
85 -
 86
86 -
 87
87 -
88
-
89
-
90
-
91
-
92
-
93
-
94
-
95
-
96
-
97
-
98
-
99
-
100
-
101
-
102
-
103
-
104
-
105
-
106
-
107
-
108
-
109
-
110
-
111
-
112
-
113
-
114
-
115
-
116
-
117
-
118
-
119
-
120
-
121
-
122
-
123
-
124
-
125
-
126
-
127
-
128
-
129
-
130
-
131
-
132
-
133
-
134
-
135
-
136
-
137
-
138
-
139
-
140
-
141
-
142
-
143
-
144
-
145
-
146
-
147
-
148
-
149
-
150
-
151
-
152
-
153
-
154
-
155
-
156
-
157
-
158
-
159
-
160
-
161
-
162
-
163
-
164
-
165
-
166
-
167
-
168
-
169
-
170
-
171
-
172
-
173
-
174
-
175
-
176
-
177
-
178
-
179
-
180
-
181
-
182
-
183
-
184
-
185
-
186
-
187
-
188
-
189
-
190
-
191
-
192
-
193
-
194
-
195
-
196
-
197
-
198
-
199
-
200
-
201
-
202
-
203
-
204
-
205
-
206
-
207
-
208
-
209
-
210
-
211
-
212
-
213
-
214
-
215
-
216
-
217
-
218
-
219
-
220
-
221
-
222
-
223
-
224
-
225
-
226
-
227
-
228
-
229
-
230
-
231
-
232
-
233
-
234
-
235
-
236
-
237
-
238
-
239
-
240
 |
 |

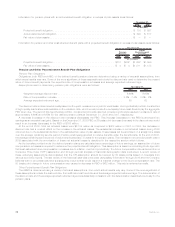
Net assets invested in separate accounts are stated at the aggregate estimated fair value of units of participation. Such value reflects
accumulated contributions, dividends and realized and unrealized investment gains or losses apportioned to such contributions, less
withdrawals, distributions, allocable expenses relating to the purchase, sale and maintenance of the assets and an allocable part of such
separate accounts’ investment expenses.
Separate account investments in fixed income and equity securities are generally carried at published market value, or if published
market values are not readily available, at estimated fair values. Investments in short-term fixed income securities are generally reflected as
cash equivalents and carried at fair value. Real estate investments, in the form of real estate investment trusts, are carried at estimated fair
value based on appraisals performed by third-party real estate appraisal firms, and generally, determined by discounting projected cash
flows over periods of time and at interest rates deemed appropriate for each investment. Information on the physical value of the property
and the sales prices of comparable properties is used to corroborate fair value estimates. Estimated fair value of hedge fund net assets is
generally determined by third-party pricing vendors using quoted market prices or through the use of pricing models which are affected by
changes in interest rates, foreign currency exchange rates, financial indices, credit spreads, market supply and demand, market volatility
and liquidity.
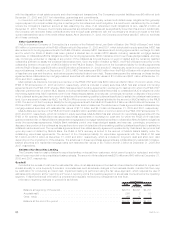
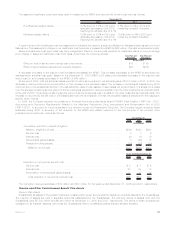
The following table summarizes the actual and target weighted-average allocations of pension plan assets within the separate
accounts:
2008 2007 2009
Weighted
Average
Actual
Allocation Weighted Average
Target Allocation
December 31,
Asset Category
Equitysecurities ............................................. 28% 38% 25%-45%
Fixedmaturitysecurities........................................ 51 44 35%-55%
Other(Realestateandalternativeinvestments) ......................... 21 18 5%-32%
Total ................................................... 100% 100%
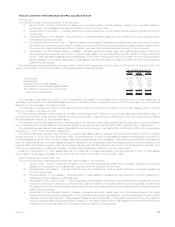
Target allocations of assets are determined with the objective of maximizing returns and minimizing volatility of net assets through
adequate asset diversification. Adjustments are made to target allocations based on an assessment of the impact of economic factors and
market conditions.
Credit and equity market volatility during 2008 resulted in a substantial decrease in the estimated fair value of the pension plan’s assets
at December 31, 2008. This decline in asset values resulted in a substantial increase in net actuarial losses at December 31, 2008, as
described in the preceding section on pension plan obligations, and will result in a significant increase in net periodic pension cost during
2009, as described in the following section on net periodic benefit cost.
Other Postretirement Benefit Plan Assets
Substantially all assets of the other postretirement benefit plans are invested within life insurance and reserve contracts issued by the
Subsidiaries. The majority of assets are held in separate accounts established by the Subsidiaries. The account values of assets held with
the Subsidiaries were $949 million and $1,125 million at December 31, 2008 and 2007, respectively. The terms of these contracts are
consistent in all material respects with those the Subsidiaries offer to unaffiliated parties that are similarly situated.
The valuation of separate accounts and the investments within such separate accounts invested in by the other postretirement benefit
plans are similar to that described in the preceding section on pension plans.
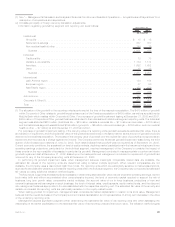
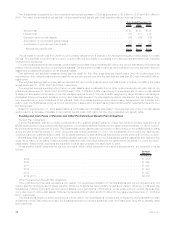
The following table summarizes the actual and target weighted-average allocations of other postretirement benefit plan assets within the
separate accounts:
2008 2007 2009
Weighted
Average
Actual
Allocation Weighted Average
Target Allocation
December 31,
Asset Category
Equitysecurities ............................................. 27% 37% 30%-45%
Fixedmaturitysecurities........................................ 71 58 55%-85%
Other(Realestateandalternativeinvestments) ......................... 2 5 0%-10%
Total ................................................... 100% 100%
Target allocations of assets are determined with the objective of maximizing returns and minimizing volatility of net assets through
adequate asset diversification. Adjustments are made to target allocations based on an assessment of the impact of economic factors and
market conditions.
Credit and equity market volatility during 2008 resulted in a decrease in the estimated fair value of the other postretirement benefit plan’s
assets at December 31, 2008. This decline in asset values resulted in an increase in net actuarial losses at December 31, 2008, as
described in the preceding section on other postretirement benefit plan obligations, and will result in a significant increase in net periodic
other postretirement benefit plan cost during 2009, as described in the following section on net periodic benefit cost.
74 MetLife, Inc.