MetLife 2008 Annual Report Download - page 174
Download and view the complete annual report
Please find page 174 of the 2008 MetLife annual report below. You can navigate through the pages in the report by either clicking on the pages listed below, or by using the keyword search tool below to find specific information within the annual report.-
 1
1 -
2
-
3
-
4
-
5
-
6
-
7
-
8
-
9
-
10
-
11
-
12
-
13
-
14
-
15
-
16
-
17
-
18
-
19
-
20
-
21
-
22
-
23
-
24
-
25
-
26
-
27
-
28
-
29
-
30
-
31
-
32
-
33
-
34
-
35
-
36
-
37
-
38
-
39
-
40
-
41
-
42
-
43
-
44
-
45
-
46
-
47
-
48
-
49
-
50
-
51
-
52
-
53
-
54
-
55
-
56
-
57
-
58
-
59
-
60
-
61
-
62
-
63
-
64
-
65
-
66
-
67
-
68
-
69
-
70
-
71
-
72
-
73
-
74
-
75
-
76
-
77
-
78
-
79
-
80
-
81
-
82
-
83
-
84
-
85
-
86
-
87
-
88
-
89
-
90
-
91
-
92
-
93
-
94
-
95
-
96
-
97
-
98
-
99
-
100
-
101
-
102
-
103
-
104
-
105
-
106
-
107
-
108
-
109
-
110
-
111
-
112
-
113
-
114
-
115
-
116
-
117
-
118
-
119
-
120
-
121
-
122
-
123
-
124
-
125
-
126
-
127
-
128
-
129
-
130
-
131
-
132
-
133
-
134
-
135
-
136
-
137
-
138
-
139
-
140
-
141
-
142
-
143
-
144
-
145
-
146
-
147
-
148
-
149
-
150
-
151
-
152
-
153
-
154
-
155
-
156
-
157
-
158
-
159
-
160
-
161
-
162
-
163
-
 164
164 -
 165
165 -
 166
166 -
 167
167 -
 168
168 -
 169
169 -
 170
170 -
 171
171 -
 172
172 -
 173
173 -
 174
174 -
 175
175 -
 176
176 -
 177
177 -
 178
178 -
 179
179 -
 180
180 -
 181
181 -
 182
182 -
 183
183 -
 184
184 -
185
-
186
-
187
-
188
-
189
-
190
-
191
-
192
-
193
-
194
-
195
-
196
-
197
-
198
-
199
-
200
-
201
-
202
-
203
-
204
-
205
-
206
-
207
-
208
-
209
-
210
-
211
-
212
-
213
-
214
-
215
-
216
-
217
-
218
-
219
-
220
-
221
-
222
-
223
-
224
-
225
-
226
-
227
-
228
-
229
-
230
-
231
-
232
-
233
-
234
-
235
-
236
-
237
-
238
-
239
-
240
 |
 |

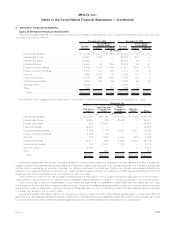
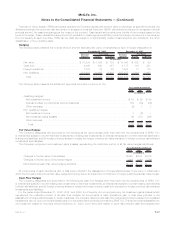
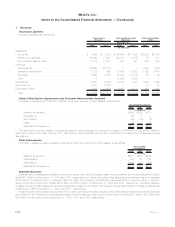
5. Deferred Policy Acquisition Costs and Value of Business Acquired
Information regarding DAC and VOBA is as follows:
DAC VOBA Total
(In millions)
Balance at January 1, 2006 . . . . . . . . . . . . . . . . . . . . . . . . . . . . . . . . . . . . . . . . $12,005 $4,643 $16,648
Capitalizations............................................... 2,825 — 2,825
Subtotal ................................................ 14,830 4,643 19,473
Less: Amortization related to:
Netinvestmentgains(losses).................................... (160) (74) (234)
Otherexpenses............................................. 1,747 391 2,138
Totalamortization .......................................... 1,587 317 1,904
Less:Unrealizedinvestmentgains(losses)............................. 79 31 110
Less:Other................................................. (48) 3 (45)
Balance at December 31, 2006 . . . . . . . . . . . . . . . . . . . . . . . . . . . . . . . . . . . . . 13,212 4,292 17,504
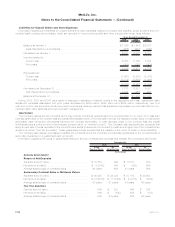
EffectofSOP05-1adoption...................................... (205) (248) (453)
Capitalizations............................................... 3,064 — 3,064
Acquisitions................................................. — 48 48
Subtotal ................................................ 16,071 4,092 20,163
Less: Amortization related to:
Netinvestmentgains(losses).................................... (115) (11) (126)
Otherexpenses............................................. 1,881 495 2,376
Totalamortization .......................................... 1,766 484 2,250
Less:Unrealizedinvestmentgains(losses)............................. 75 63 138
Less:Other................................................. (30) (5) (35)
Balance at December 31, 2007 . . . . . . . . . . . . . . . . . . . . . . . . . . . . . . . . . . . . . 14,260 3,550 17,810
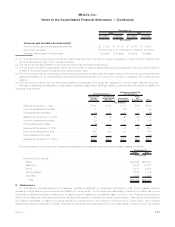
Capitalizations............................................... 3,092 — 3,092
Acquisitions................................................. — (5) (5)
Subtotal ................................................ 17,352 3,545 20,897
Less: Amortization related to:
Netinvestmentgains(losses).................................... 489 32 521
Otherexpenses............................................. 2,460 508 2,968
Totalamortization .......................................... 2,949 540 3,489
Less:Unrealizedinvestmentgains(losses)............................. (2,753) (599) (3,352)
Less:Other................................................. 503 113 616
Balance at December 31, 2008 . . . . . . . . . . . . . . . . . . . . . . . . . . . . . . . . . . . . . $16,653 $3,491 $20,144
See Note 2 for a description of acquisitions and dispositions.
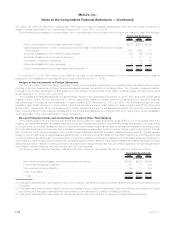
The estimated future amortization expense allocated to other expenses for the next five years for VOBA is $375 million in 2009,
$353 million in 2010, $322 million in 2011, $289 million in 2012, and $250 million in 2013.
Amortization of VOBA and DAC is attributed to both investment gains and losses and other expenses which are the amount of gross
margins or profits originating from transactions other than investment gains and losses. Unrealized investment gains and losses provide
information regarding the amount of DAC and VOBA that would have been amortized if such gains and losses had been recognized.
F-51MetLife, Inc.
MetLife, Inc.
Notes to the Consolidated Financial Statements — (Continued)