MetLife 2008 Annual Report Download - page 38
Download and view the complete annual report
Please find page 38 of the 2008 MetLife annual report below. You can navigate through the pages in the report by either clicking on the pages listed below, or by using the keyword search tool below to find specific information within the annual report.-
 1
1 -
2
-
3
-
4
-
5
-
6
-
7
-
8
-
9
-
10
-
11
-
12
-
13
-
14
-
15
-
16
-
17
-
18
-
19
-
20
-
21
-
22
-
23
-
24
-
25
-
26
-
27
-
 28
28 -
 29
29 -
 30
30 -
 31
31 -
 32
32 -
 33
33 -
 34
34 -
 35
35 -
 36
36 -
 37
37 -
 38
38 -
 39
39 -
 40
40 -
 41
41 -
 42
42 -
 43
43 -
 44
44 -
 45
45 -
 46
46 -
 47
47 -
 48
48 -
49
-
50
-
51
-
52
-
53
-
54
-
55
-
56
-
57
-
58
-
59
-
60
-
61
-
62
-
63
-
64
-
65
-
66
-
67
-
68
-
69
-
70
-
71
-
72
-
73
-
74
-
75
-
76
-
77
-
78
-
79
-
80
-
81
-
82
-
83
-
84
-
85
-
86
-
87
-
88
-
89
-
90
-
91
-
92
-
93
-
94
-
95
-
96
-
97
-
98
-
99
-
100
-
101
-
102
-
103
-
104
-
105
-
106
-
107
-
108
-
109
-
110
-
111
-
112
-
113
-
114
-
115
-
116
-
117
-
118
-
119
-
120
-
121
-
122
-
123
-
124
-
125
-
126
-
127
-
128
-
129
-
130
-
131
-
132
-
133
-
134
-
135
-
136
-
137
-
138
-
139
-
140
-
141
-
142
-
143
-
144
-
145
-
146
-
147
-
148
-
149
-
150
-
151
-
152
-
153
-
154
-
155
-
156
-
157
-
158
-
159
-
160
-
161
-
162
-
163
-
164
-
165
-
166
-
167
-
168
-
169
-
170
-
171
-
172
-
173
-
174
-
175
-
176
-
177
-
178
-
179
-
180
-
181
-
182
-
183
-
184
-
185
-
186
-
187
-
188
-
189
-
190
-
191
-
192
-
193
-
194
-
195
-
196
-
197
-
198
-
199
-
200
-
201
-
202
-
203
-
204
-
205
-
206
-
207
-
208
-
209
-
210
-
211
-
212
-
213
-
214
-
215
-
216
-
217
-
218
-
219
-
220
-
221
-
222
-
223
-
224
-
225
-
226
-
227
-
228
-
229
-
230
-
231
-
232
-
233
-
234
-
235
-
236
-
237
-
238
-
239
-
240
 |
 |

estimated gross profits and margins. Policy fees from variable life and annuity and investment-type products are typically calculated as a
percentage of the average assets in policyholder accounts. The value of these assets can fluctuate depending on equity performance.
Net investment income increased by $162 million. Net investment income from the general account portion of investment-type products
and other businesses increased by $47 million and $115 million, respectively. Management attributes $109 million of this increase to an
increase in yields, primarily due to higher returns on other limited partnership interests. Additionally, management attributes $53 million to
growth in the average asset base across various investment types.
Expenses
Total expenses increased by $862 million, or 7%, to $13,396 million for the year ended December 31, 2007 from $12,534 million for
2006.
Policyholder benefits and claims increased by $330 million primarily due to an increase in the closed block-related policyholder dividend
obligation of $115 million which was primarily driven by net investment gains. Unfavorable mortality in the life products, as well as revisions
to policyholder benefits in both years, contributed $199 million to this increase. Included in this increase was $72 million of unfavorable
mortality in the closed block and a prior year net increase of $15 million in the excess mortality liability on specific blocks of life insurance
policies. Higher amortization of sales inducements resulting from business growth and revisions to management’s assumptions used to
determine estimated gross profits and margins, partially offset by lower costs of guaranteed annuity benefit riders and related hedging
increased annuity benefits by $37 million. Partially offsetting these increases, policyholder benefits and claims decreased by $21 million
commensurate with the decrease in premiums discussed above.
Interest credited to policyholder account balances decreased by $5 million. Interest credited on the general account portion of
investment-type products and other businesses decreased by $16 million and $9 million, respectively. Of the $16 million decrease on the
general account portion of investment-type products, management attributed $67 million to higher crediting rates, more than offset by
$83 million due to lower average policyholder account balances. Partially offsetting these decreases was lower amortization of the excess
interest reserves on acquired annuity and universal life blocks of business of $20 million primarily driven by lower lapses in 2007.
Policyholder dividends increased by $19 million due to growth in the business.
Higher other expenses of $518 million include higher DAC amortization of $315 million resulting from business growth, lower net
investment losses and revisions to management’s assumptions used to determine estimated gross profits and margins. The remaining
increase in other expenses of $203 million was comprised of $172 million associated with business growth, information technology and
other general expenses, $7 million due to the impact of revisions to certain liabilities including pension and postretirement liabilities and
policyholder liabilities in 2006, and $24 million associated with the write-off of a receivable from one of the Company’s joint venture
partners in 2007.
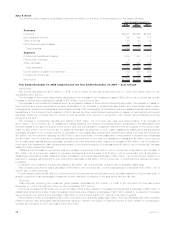
International
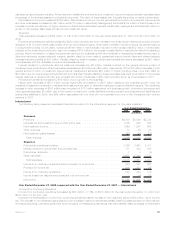
The following table presents consolidated financial information for the International segment for the years indicated:
2008 2007 2006
Years Ended December 31,
(In millions)
Revenues
Premiums..................................................... $3,470 $3,096 $2,722
Universallifeandinvestment-typeproductpolicyfees ........................ 1,095 995 805
Netinvestmentincome............................................. 1,249 1,247 949
Otherrevenues ................................................. 18 24 28
Netinvestmentgains(losses) ........................................ 167 56 (10)
Totalrevenues................................................. 5,999 5,418 4,494
Expenses
Policyholderbenefitsandclaims ...................................... 3,166 2,460 2,411
Interestcreditedtopolicyholderaccountbalances........................... 171 354 288
Policyholderdividends............................................. 7 4 (3)
Otherexpenses ................................................. 1,671 1,749 1,531
Totalexpenses ................................................ 5,015 4,567 4,227
Incomefromcontinuingoperationsbeforeprovisionforincometax ................ 984 851 267
Provisionforincometax............................................ 404 207 95
Incomefromcontinuingoperations..................................... 580 644 172
Income(loss)fromdiscontinuedoperations,netofincometax ................... — (9) 28
Netincome.................................................... $ 580 $ 635 $ 200
Year Ended December 31, 2008 compared with the Year Ended December 31, 2007 — International
Income from Continuing Operations
Income from continuing operations decreased by $64 million, or 10%, to $580 million for the year ended December 31, 2008 from
$644 million for the prior year.
Included in this decrease in income from continuing operations was an increase in net investment gains of $39 million, net of income
tax. The increase in net investment gains was due to an increase in gains on derivatives partially offset by losses primarily on fixed maturity
and equity securities. Derivative gains were driven by gains on freestanding derivatives that were partially offset by losses on embedded
35MetLife, Inc.