MetLife 2008 Annual Report Download - page 88
Download and view the complete annual report
Please find page 88 of the 2008 MetLife annual report below. You can navigate through the pages in the report by either clicking on the pages listed below, or by using the keyword search tool below to find specific information within the annual report.-
 1
1 -
2
-
3
-
4
-
5
-
6
-
7
-
8
-
9
-
10
-
11
-
12
-
13
-
14
-
15
-
16
-
17
-
18
-
19
-
20
-
21
-
22
-
23
-
24
-
25
-
26
-
27
-
28
-
29
-
30
-
31
-
32
-
33
-
34
-
35
-
36
-
37
-
38
-
39
-
40
-
41
-
42
-
43
-
44
-
45
-
46
-
47
-
48
-
49
-
50
-
51
-
52
-
53
-
54
-
55
-
56
-
57
-
58
-
59
-
60
-
61
-
62
-
63
-
64
-
65
-
66
-
67
-
68
-
69
-
70
-
71
-
72
-
73
-
74
-
75
-
76
-
77
-
 78
78 -
 79
79 -
 80
80 -
 81
81 -
 82
82 -
 83
83 -
 84
84 -
 85
85 -
 86
86 -
 87
87 -
 88
88 -
 89
89 -
 90
90 -
 91
91 -
 92
92 -
 93
93 -
 94
94 -
 95
95 -
 96
96 -
 97
97 -
 98
98 -
99
-
100
-
101
-
102
-
103
-
104
-
105
-
106
-
107
-
108
-
109
-
110
-
111
-
112
-
113
-
114
-
115
-
116
-
117
-
118
-
119
-
120
-
121
-
122
-
123
-
124
-
125
-
126
-
127
-
128
-
129
-
130
-
131
-
132
-
133
-
134
-
135
-
136
-
137
-
138
-
139
-
140
-
141
-
142
-
143
-
144
-
145
-
146
-
147
-
148
-
149
-
150
-
151
-
152
-
153
-
154
-
155
-
156
-
157
-
158
-
159
-
160
-
161
-
162
-
163
-
164
-
165
-
166
-
167
-
168
-
169
-
170
-
171
-
172
-
173
-
174
-
175
-
176
-
177
-
178
-
179
-
180
-
181
-
182
-
183
-
184
-
185
-
186
-
187
-
188
-
189
-
190
-
191
-
192
-
193
-
194
-
195
-
196
-
197
-
198
-
199
-
200
-
201
-
202
-
203
-
204
-
205
-
206
-
207
-
208
-
209
-
210
-
211
-
212
-
213
-
214
-
215
-
216
-
217
-
218
-
219
-
220
-
221
-
222
-
223
-
224
-
225
-
226
-
227
-
228
-
229
-
230
-
231
-
232
-
233
-
234
-
235
-
236
-
237
-
238
-
239
-
240
 |
 |
included within our other limited partnerships and real estate and real estate joint venture portfolios.Further, in light of the current market
conditions, liquidity will be reinvested in a prudent manner and invested according to our ALM discipline in appropriate assets over time.
However, considering the continued, uncertain credit market conditions, management plans to continue to maintain a slightly higher than
normal level of short-term liquidity. Net investment income may be adversely affected if the reinvestment process occurs over an extended
period of time due to challenging market conditions or asset availability.
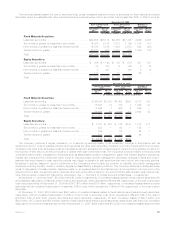
Year Ended December 31, 2007 compared with the Year Ended December 31, 2006
Net investment income increased by $1,699 million, or 10%, to $18,328 million for the year ended December 31, 2007 from
$16,629 million for the comparable 2006 period. Excluding the impacts of discontinued operations and periodic settlement payments on
derivatives instruments as described in notes 4 and 5 to the yield table presented above, net investment income increased by
$1,816 million, or 11%, to $18,063 million for the year ended December 31, 2007 from $16,247 million for the comparable 2006 period.
Management attributes $1,078 million of this increase to growth in the average asset base and $738 million to an increase in yields.
Average invested assets are calculated on the cost basis without unrealized gains and losses. The increase in net investment income
attributable to higher yields was primarily due to higher returns on fixed maturity securities, other limited partnership interests excluding
hedge funds, equity securities and improved securities lending results, partially offset by lower returns on real estate and real estate joint
ventures, cash and short-term investments, hedge funds and mortgage loans. The improvement in yields associated with fixed maturity
securities was due primarily to higher bond prepayment fees related to decreasing interest rates in the second half of 2007 and to a
repositioning of the portfolio in 2006 during a rising interest rate environment. The improvement in yields associated with other limited
partnership interests, excluding hedge funds, was due primarily to a robust private equity market resulting in improved returns on equity
based funds and increased distributions on cost basis funds. The increase in equity securities yields is primarily related to increased
earnings on the non-redeemable preferred securities comprised of perpetual hybrid securities and higher dividend income on our common
stock holdings. The decrease in real estate and real estate joint ventures yields was primarily due lower income from the sale of the Peter
Cooper and Stuyvesant Town properties in fourth quarter 2006 and reinvestment in real estate joint ventures and development funds with
more variable income streams. The decrease in yields for cash and short-term investment was primarily attributable to declines in short-
term interest rates in the second half of 2007. The decrease in hedge fund yields was primarily due to increasing volatility in private equity
markets in the latter half of 2007, driven by economic uncertainty as reflected in credit and equity markets. The decrease in yields
associated with our mortgage loan portfolio was primarily attributable to lower prepayments on commercial mortgage loans as well as new
loan production at lower yields due to the declines in interest rates in the second half of 2007.
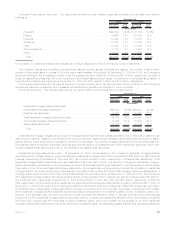
Fixed Maturity and Equity Securities Available-for-Sale
Fixed maturity securities consisted principally of publicly-traded and privately placed fixed maturity securities, and represented 58% and
71% of total cash and invested assets at December 31, 2008 and 2007, respectively. Based on estimated fair value, public fixed maturity
securities represented $156.7 billion, or 83%, and $196.7 billion, or 85%, of total fixed maturity securities at December 31, 2008 and
2007, respectively. Based on estimated fair value, private fixed maturity securities represented $31.6 billion, or 17%, and $35.6 billion, or
15%, of total fixed maturity securities at December 31, 2008 and 2007, respectively.
Valuation of Securities. Management is responsible for the determination of estimated fair value. The estimated fair value of publicly-
traded fixed maturity, equity and trading securities as well as short-term investments is determined by management after considering one of
three primary sources of information: quoted market prices in active markets, independent pricing services, or independent broker
quotations. The number of quotes obtained varies by instrument and depends on the liquidity of the particular instrument.Generally we
obtain prices from multiple pricing services to cover all asset classes and do obtain multiple prices for certain securities, but ultimately
utilize the price with the highest placement in the fair value hierarchy. Independent pricing services that value these instruments use market
standard valuation methodologies based on inputs that are market observable or can be derived principally from or corroborated by
observable market data. Such observable inputs include benchmarking prices for similar assets in active, liquid markets, quoted prices in
markets that are not active and observable yields and spreads in the market. The market standard valuation methodologies utilized include:
discounted cash flow methodologies, matrix pricing or similar techniques. The assumptions and inputs in applying these market standard
valuation methodologies include, but are not limited to, interest rates, credit standing of the issuer or counterparty, industry sector of the
issuer, coupon rate, call provisions, sinking fund requirements, maturity, estimated duration, and management’s assumptions regarding
liquidity and estimated future cash flows. When a price is not available in the active market or through an independent pricing service,
management will value the security primarily using independent non-binding broker quotations. Independent non-binding broker quotations
utilize inputs that are not market observable or cannot be derived principally from or corroborated by observable market data.
Senior management, independent of the trading and investing functions, is responsible for the oversight of control systems and
valuation policies, including reviewing and approving new transaction types and markets, for ensuring that observable market prices and
market-based parameters are used for valuation wherever possible and for determining that judgmental valuation adjustments, if any, are
based upon established policies and are applied consistently over time. Management reviews its valuation methodologies on an ongoing
basis and ensures that any changes to valuation methodologies are justified. The Company gains assurance on the overall reasonableness
and consistent application of input assumptions, valuation methodologies, and compliance with accounting standards for fair value
determination through various controls designed to ensure that the financial assets and financial liabilities are appropriately valued and
represent an exit price. The control systems and procedures include, but are not limited to, analysis of portfolio returns to corresponding
benchmark returns, comparing a sample of executed prices of securities sold to the fair value estimates, comparing fair value estimates to
management’s knowledge of the current market, reviewing the bid/ask spreads to assess activity and ongoing confirmation that
independent pricing services use, wherever possible, market-based parameters for valuation. Management determines the observability
of inputs used in estimated fair values received from independent pricing sources or brokers by assessing whether these inputs can be
corroborated by observable market data. The Company also follows a formal process to challenge any prices received from independent
pricing services that are not considered representative of fair value. If we conclude that prices received from independent pricing services
are not reflective of market activity or representative of estimated fair value, we will seek independent non-binding broker quotes or use an
internally developed valuation to override these prices. Such overrides are classified as Level 3. Despite the credit events prevalent in the
current dislocated markets and reduced levels of liquidity at the end of 2008, our internally developed valuations of current estimated fair
85MetLife, Inc.