MetLife 2008 Annual Report Download - page 210
Download and view the complete annual report
Please find page 210 of the 2008 MetLife annual report below. You can navigate through the pages in the report by either clicking on the pages listed below, or by using the keyword search tool below to find specific information within the annual report.-
 1
1 -
2
-
3
-
4
-
5
-
6
-
7
-
8
-
9
-
10
-
11
-
12
-
13
-
14
-
15
-
16
-
17
-
18
-
19
-
20
-
21
-
22
-
23
-
24
-
25
-
26
-
27
-
28
-
29
-
30
-
31
-
32
-
33
-
34
-
35
-
36
-
37
-
38
-
39
-
40
-
41
-
42
-
43
-
44
-
45
-
46
-
47
-
48
-
49
-
50
-
51
-
52
-
53
-
54
-
55
-
56
-
57
-
58
-
59
-
60
-
61
-
62
-
63
-
64
-
65
-
66
-
67
-
68
-
69
-
70
-
71
-
72
-
73
-
74
-
75
-
76
-
77
-
78
-
79
-
80
-
81
-
82
-
83
-
84
-
85
-
86
-
87
-
88
-
89
-
90
-
91
-
92
-
93
-
94
-
95
-
96
-
97
-
98
-
99
-
100
-
101
-
102
-
103
-
104
-
105
-
106
-
107
-
108
-
109
-
110
-
111
-
112
-
113
-
114
-
115
-
116
-
117
-
118
-
119
-
120
-
121
-
122
-
123
-
124
-
125
-
126
-
127
-
128
-
129
-
130
-
131
-
132
-
133
-
134
-
135
-
136
-
137
-
138
-
139
-
140
-
141
-
142
-
143
-
144
-
145
-
146
-
147
-
148
-
149
-
150
-
151
-
152
-
153
-
154
-
155
-
156
-
157
-
158
-
159
-
160
-
161
-
162
-
163
-
164
-
165
-
166
-
167
-
168
-
169
-
170
-
171
-
172
-
173
-
174
-
175
-
176
-
177
-
178
-
179
-
180
-
181
-
182
-
183
-
184
-
185
-
186
-
187
-
188
-
189
-
190
-
191
-
192
-
193
-
194
-
195
-
196
-
197
-
198
-
199
-
 200
200 -
 201
201 -
 202
202 -
 203
203 -
 204
204 -
 205
205 -
 206
206 -
 207
207 -
 208
208 -
 209
209 -
 210
210 -
 211
211 -
 212
212 -
 213
213 -
 214
214 -
 215
215 -
 216
216 -
 217
217 -
 218
218 -
 219
219 -
 220
220 -
221
-
222
-
223
-
224
-
225
-
226
-
227
-
228
-
229
-
230
-
231
-
232
-
233
-
234
-
235
-
236
-
237
-
238
-
239
-
240
 |
 |

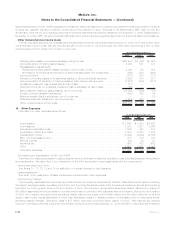
The binomial model used by the Company incorporates the contractual term of the Stock Options and then factors in expected exercise
behavior and a post-vesting termination rate, or the rate at which vested options are exercised or expire prematurely due to termination of
employment, to derive an expected life. Exercise behavior in the binomial lattice model used by the Company is expressed using an
exercise multiple, which reflects the ratio of exercise price to the strike price of Stock Options granted at which holders of the Stock
Options are expected to exercise. The exercise multiple is derived from actual historical exercise activity. The post-vesting termination rate
is determined from actual historical exercise experience and expiration activity under the Incentive Plans.
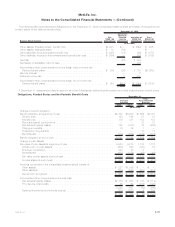
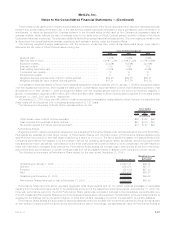
The following weighted average assumptions, with the exception of risk-free rate, which is expressed as a range, were used to
determine the fair value of Stock Options issued during the:
2008 2007 2006
Years Ended December 31,
Dividendyield ....................................... 1.21% 0.94% 1.04%
Risk-freerateofreturn.................................. 1.91%-7.21% 4.30%-5.32% 4.17%-4.96%
Expectedvolatility..................................... 24.85% 19.54% 22.00%
Exercisemultiple ..................................... 1.73 1.66 1.52
Post-vestingterminationrate.............................. 3.05% 3.66% 4.09%
Contractualterm(years)................................. 10 10 10
Expectedlife(years) ................................... 6 6 6
Weighted average exercise price of stock options granted . . . . . . . . . . $59.48 $62.86 $50.21
Weighted average fair value of stock options granted . . . . . . . . . . . . . . $17.51 $17.76 $13.84
Compensation expense related to Stock Option awards expected to vest and granted prior to January 1, 2006 is recognized ratably
over the requisite service period, which equals the vesting term. Compensation expense related to Stock Option awards expected to vest
and granted on or after January 1, 2006 is recognized ratably over the requisite service period or the period to retirement eligibility, if
shorter. Compensation expense of $51 million, $55 million and $56 million related to Stock Options was recognized for the years ended
December 31, 2008, 2007 and 2006, respectively.
At December 31, 2008, there were $43 million of total unrecognized compensation costs related to Stock Options. It is expected that
these costs will be recognized over a weighted average period of 1.81 years.
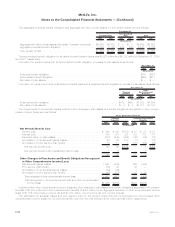
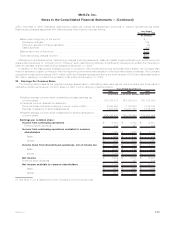
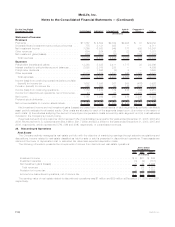
The following is a summary of Stock Option exercise activity for the:
2008 2007 2006
Years Ended
December 31,
(In millions)
Totalintrinsicvalueofstockoptionsexercised ....................................... $36 $122 $65
Cashreceivedfromexerciseofstockoptions........................................ $45 $110 $83
Taxbenefitrealizedfromstockoptionsexercised...................................... $13 $ 43 $23
Performance Shares
Beginning in 2005, certain members of management were awarded Performance Shares under (and as defined in) the 2005 Stock Plan.
Participants are awarded an initial target number of Performance Shares with the final number of Performance Shares payable being
determined by the product of the initial target multiplied by a factor of 0.0 to 2.0. The factor applied is based on measurements of the
Company’s performance with respect to: (i) the change in annual net operating earnings per share, as defined; and (ii) the proportionate
total shareholder return, as defined, with reference to the three-year performance period relative to other companies in the S&P Insurance
Index with reference to the same three-year period. Performance Share awards will normally vest in their entirety at the end of the three-
year performance period (subject to certain contingencies) and will be payable entirely in shares of the Company’s common stock.
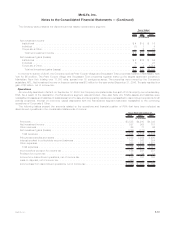
The following is a summary of Performance Share activity for the year ended December 31, 2008:
Performance Shares
Weighted Average
Grant Date
Fair Value
Outstanding at January 1, 2008 . . . . . . . . . . . . . . . . . . . . . . . . . . . . . . . . . . . . . 2,690,125 $48.39
Granted . . . . . . . . . . . . . . . . . . . . . . . . . . . . . . . . . . . . . . . . . . . . . . . . . . . . . 954,075 $57.17
Forfeited .................................................... (89,125) $57.43
Paid . . . . . . . . . . . . . . . . . . . . . . . . . . . . . . . . . . . . . . . . . . . . . . . . . . . . . . . (968,425) $36.87
Outstanding at December 31, 2008 . . . . . . . . . . . . . . . . . . . . . . . . . . . . . . . . . . . 2,586,650 $55.63
Performance Shares expected to vest at December 31, 2008 . . . . . . . . . . . . . . . . . . 2,535,784 $55.56
Performance Share amounts above represent aggregate initial target awards and do not reflect potential increases or decreases
resulting from the final performance factor to be determined at the end of the respective performance period. At December 31, 2008, the
three year performance period for the 2006 Performance Share grants was completed. Included in the immediately preceding table are
812,975 outstanding Performance Shares to which the final performance factor will be applied. The calculation of the performance factor is
expected to be finalized during the second quarter of 2009 after all data necessary to perform the calculation is publicly available.
Performance Share awards are accounted for as equity awards but are not credited with dividend-equivalents for actual dividends paid
on the Holding Company’s common stock during the performance period. Accordingly, the estimated fair value of Performance Shares is
F-87MetLife, Inc.
MetLife, Inc.
Notes to the Consolidated Financial Statements — (Continued)